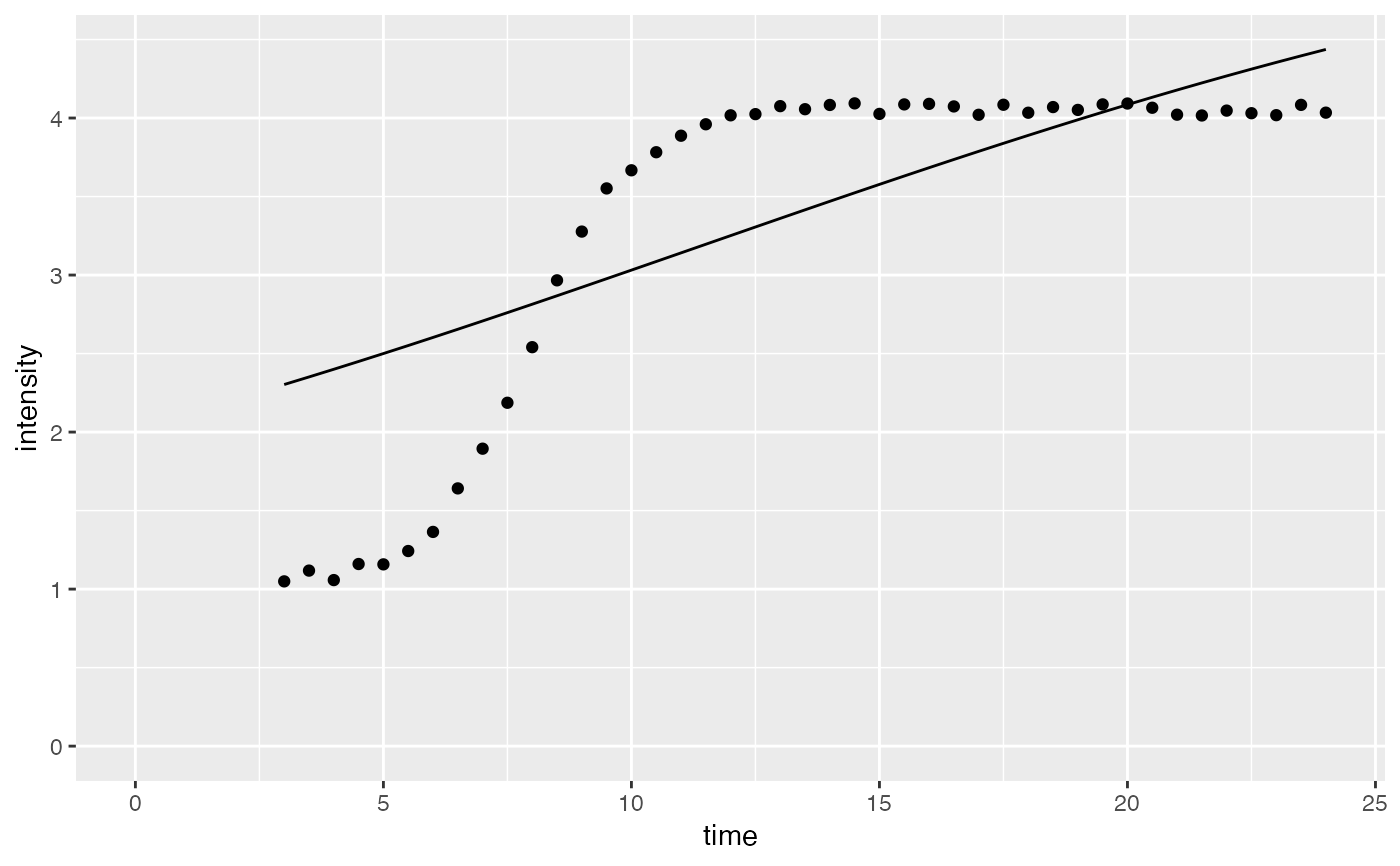
Calculates intensities for given time points (x) by using sigmoidal fit model and parameters (maximum, slopeParam, midpoint, and h0).
Arguments
- x
the "time" column of the dataframe.
- maximum
the maximum intensity that the sigmoidal function can reach while time approaches infinity.
- slopeParam
the slope parameter of the sigmoidal function at the steepest point.
- midPoint
the x axis value of the steepest point in the function.
- h0
the lower asymptote (baseline) intensity
Value
Returns the predicted intensities for given time points with the given sigmoidal fit parameters.
Examples
# runif() is used here for consistency with previous versions of the sicegar package. However,
# rnorm() will generate symmetric errors, producing less biased numerical parameter estimates.
# We recommend errors generated with rnorm() for any simulation studies on sicegar.
time <- seq(3, 24, 0.5)

#simulate intensity data and add noise
noise_parameter <- 0.1
intensity_noise <- stats::runif(n = length(time), min = 0, max = 1) * noise_parameter
intensity <- sigmoidalFitFormula_h0(time, maximum = 4, slopeParam = 1, midPoint = 8, h0 = 1)
intensity <- intensity + intensity_noise

dataInput <- data.frame(intensity = intensity, time = time)
normalizedInput <- normalizeData(dataInput)
parameterVector <- sigmoidalFitFunction_h0(normalizedInput, tryCounter = 1)

#Check the results
# sigmoidalFitFunction_h0() is run on the startList param values (because 'tryCounter = 1')
# use multipleFitFunction() for multiple random starts in order to optimize
if(parameterVector$isThisaFit){
 intensityTheoretical <- sigmoidalFitFormula_h0(time,
                                             maximum = parameterVector$maximum_Estimate,
                                             slopeParam = parameterVector$slopeParam_Estimate,
                                             midPoint = parameterVector$midPoint_Estimate,
                                             h0 = parameterVector$h0_Estimate)

 comparisonData <- cbind(dataInput, intensityTheoretical)

 require(ggplot2)
 ggplot(comparisonData) +
   geom_point(aes(x = time, y = intensity)) +
   geom_line(aes(x = time, y = intensityTheoretical)) +
   expand_limits(x = 0, y = 0)
}


if(!parameterVector$isThisaFit){
  print(parameterVector)
}
if(!parameterVector$isThisaFit){
print(parameterVector)
}