Calls the fitting algorithms to fit the data multiple times with starting from different randomly generated initial parameters in each run. Multiple attempts at fitting the data are necessary to avoid local minima.
Usage
multipleFitFunction(
  dataInput,
  dataInputName = NA,
  model,
  n_runs_min = 20,
  n_runs_max = 500,
  showDetails = FALSE,
  ...
)
Arguments
- dataInput
A dataframe or a list containing the dataframe. The dataframe should be composed of at least two columns. One represents time, and the other represents intensity. The data should be normalized with the normalize data function sicegar::normalizeData() before being imported into this function.
- dataInputName
Name of data set (Default is 'NA').
- model
Type of fit model that will be used. Can be "sigmoidal", or "double_sigmoidal".
- n_runs_min
This number indicates the lower limit of the successful fitting attempts. It should be smaller than the upper limit of the fitting attempts (n_runs_max). Default is 20.
- n_runs_max
This number indicates the upper limit of the fitting attempts. Default is 500.
- showDetails
Logical if TRUE prints details of intermediate steps of individual fits (Default is FALSE).
- ...
All other arguments that model functions ("sigmoidalFitFunction" and, "doublesigmoidalFitFunction") may need.
Examples
# runif() is used here for consistency with previous versions of the sicegar package. However,
# rnorm() will generate symmetric errors, producing less biased numerical parameter estimates.
# We recommend errors generated with rnorm() for any simulation studies on sicegar.
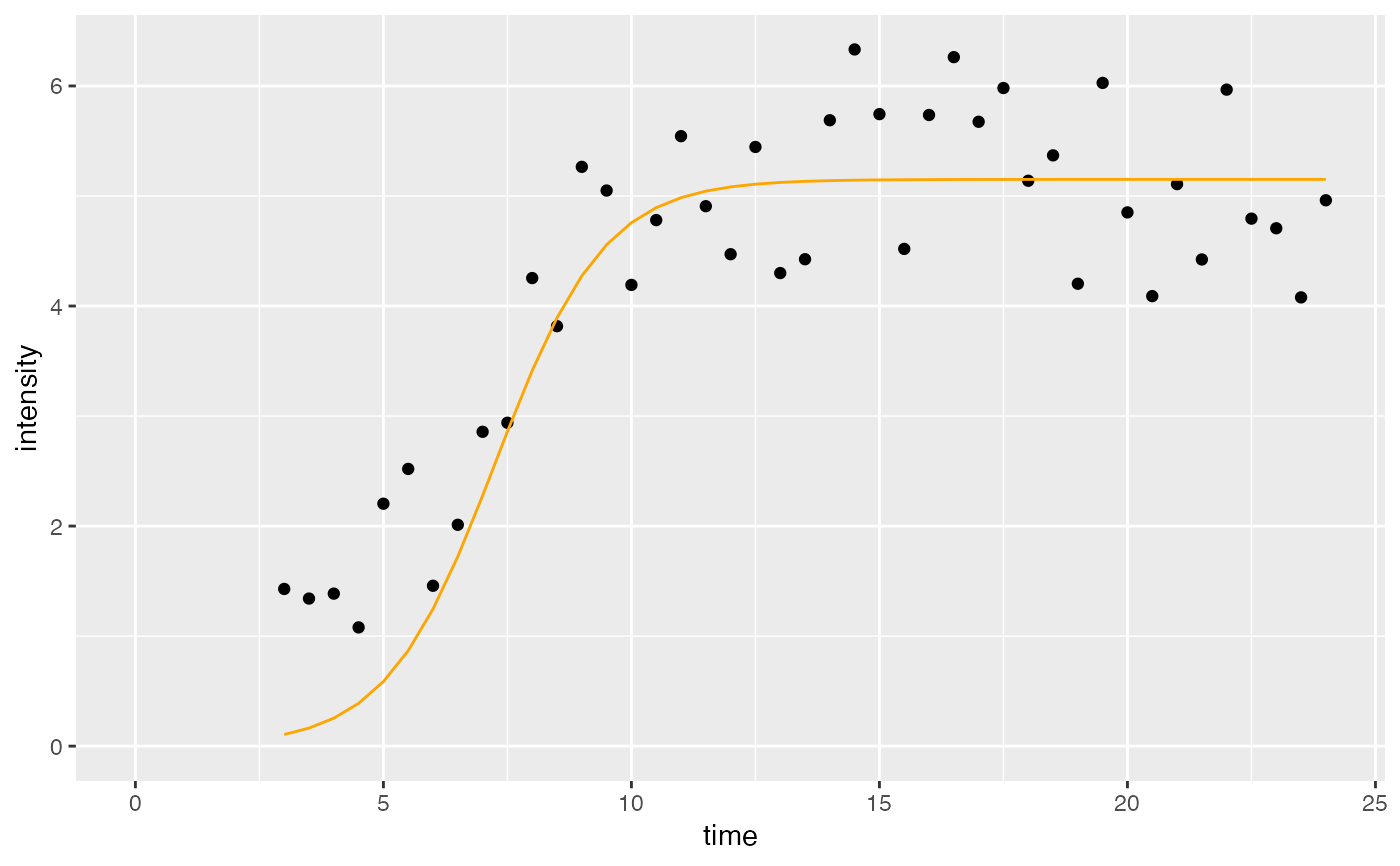
# Example 1 (sigmoidal function with normalization)
time <- seq(3, 24, 0.5)
#simulate intensity data and add noise
noise_parameter <- 2.5
intensity_noise <- stats::runif(n = length(time), min = 0, max = 1) * noise_parameter
intensity <- sigmoidalFitFormula(time, maximum = 4, slopeParam = 1, midPoint = 8)
intensity <- intensity + intensity_noise
dataInput <- data.frame(intensity = intensity, time = time)
normalizedInput <- normalizeData(dataInput, dataInputName = "sample001")
parameterVector <- multipleFitFunction(dataInput = normalizedInput,
model = "sigmoidal",
n_runs_min = 20,
n_runs_max = 500)
#Check the results
if(parameterVector$isThisaFit){
intensityTheoretical <- sigmoidalFitFormula(time,
maximum = parameterVector$maximum_Estimate,
slopeParam = parameterVector$slopeParam_Estimate,
midPoint = parameterVector$midPoint_Estimate)
comparisonData <- cbind(dataInput, intensityTheoretical)
print(parameterVector$residual_Sum_of_Squares)
require(ggplot2)
ggplot(comparisonData)+
geom_point(aes(x = time, y = intensity)) +
geom_line(aes(x = time, y = intensityTheoretical), color = "orange") +
expand_limits(x = 0, y = 0)
}
#> [1] 0.5808065
#> Loading required package: ggplot2
 if(!parameterVector$isThisaFit){
print(parameterVector)
}
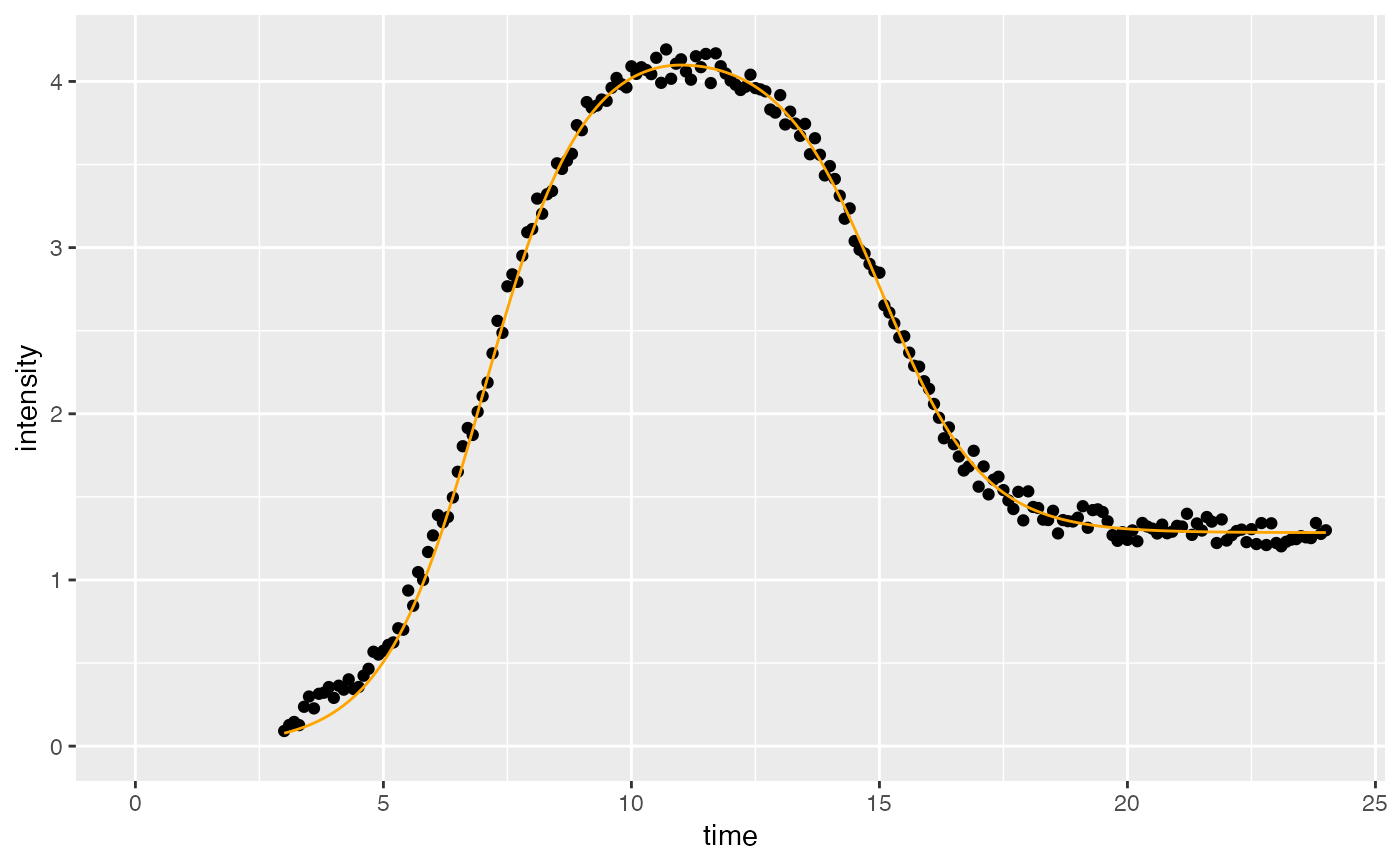
# Example 2 (doublesigmoidal function with normalization)
time <- seq(3, 24, 0.1)
#simulate intensity data with noise
noise_parameter <- 0.2
intensity_noise <- stats::runif(n = length(time), min = 0, max = 1) * noise_parameter
intensity <- doublesigmoidalFitFormula(time,
finalAsymptoteIntensityRatio = .3,
maximum = 4,
slope1Param = 1,
midPoint1Param = 7,
slope2Param = 1,
midPointDistanceParam = 8)
intensity <- intensity + intensity_noise
dataInput <- data.frame(intensity = intensity, time = time)
normalizedInput <- normalizeData(dataInput)
parameterVector <- multipleFitFunction(dataInput = normalizedInput,
dataInputName="sample001",
model = "doublesigmoidal",
n_runs_min = 20,
n_runs_max = 500,
showDetails = FALSE)
#Check the results
if(parameterVector$isThisaFit){
intensityTheoretical <-
doublesigmoidalFitFormula(
time,
finalAsymptoteIntensityRatio = parameterVector$finalAsymptoteIntensityRatio_Estimate,
maximum = parameterVector$maximum_Estimate,
slope1Param = parameterVector$slope1Param_Estimate,
midPoint1Param = parameterVector$midPoint1Param_Estimate,
slope2Param = parameterVector$slope2Param_Estimate,
midPointDistanceParam = parameterVector$midPointDistanceParam_Estimate)
comparisonData <- cbind(dataInput, intensityTheoretical)
require(ggplot2)
ggplot(comparisonData) +
geom_point(aes(x = time, y = intensity)) +
geom_line(aes(x = time, y = intensityTheoretical), color = "orange") +
expand_limits(x = 0, y = 0)
}
if(!parameterVector$isThisaFit){
print(parameterVector)
}
# Example 2 (doublesigmoidal function with normalization)
time <- seq(3, 24, 0.1)
#simulate intensity data with noise
noise_parameter <- 0.2
intensity_noise <- stats::runif(n = length(time), min = 0, max = 1) * noise_parameter
intensity <- doublesigmoidalFitFormula(time,
finalAsymptoteIntensityRatio = .3,
maximum = 4,
slope1Param = 1,
midPoint1Param = 7,
slope2Param = 1,
midPointDistanceParam = 8)
intensity <- intensity + intensity_noise
dataInput <- data.frame(intensity = intensity, time = time)
normalizedInput <- normalizeData(dataInput)
parameterVector <- multipleFitFunction(dataInput = normalizedInput,
dataInputName="sample001",
model = "doublesigmoidal",
n_runs_min = 20,
n_runs_max = 500,
showDetails = FALSE)
#Check the results
if(parameterVector$isThisaFit){
intensityTheoretical <-
doublesigmoidalFitFormula(
time,
finalAsymptoteIntensityRatio = parameterVector$finalAsymptoteIntensityRatio_Estimate,
maximum = parameterVector$maximum_Estimate,
slope1Param = parameterVector$slope1Param_Estimate,
midPoint1Param = parameterVector$midPoint1Param_Estimate,
slope2Param = parameterVector$slope2Param_Estimate,
midPointDistanceParam = parameterVector$midPointDistanceParam_Estimate)
comparisonData <- cbind(dataInput, intensityTheoretical)
require(ggplot2)
ggplot(comparisonData) +
geom_point(aes(x = time, y = intensity)) +
geom_line(aes(x = time, y = intensityTheoretical), color = "orange") +
expand_limits(x = 0, y = 0)
}
 if(!parameterVector$isThisaFit){
print(parameterVector)
}
if(!parameterVector$isThisaFit){
print(parameterVector)
}