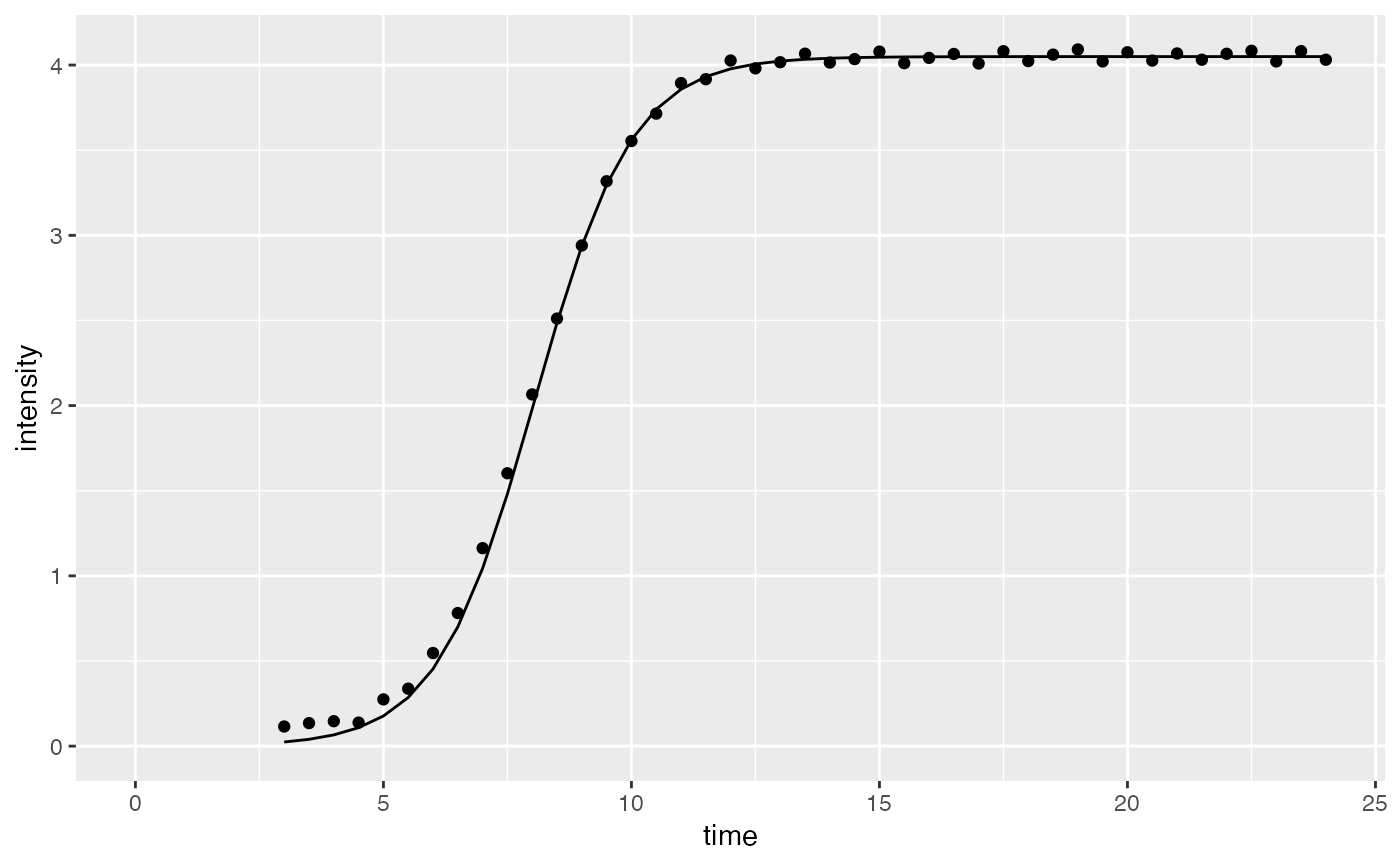
Calculates intensities for given time points (x) by using sigmoidal fit model and parameters (maximum, slopeParam, and midpoint).
Value
Returns the predicted intensities for given time points with the given sigmoidal fit parameters.
Examples
# runif() is used here for consistency with previous versions of the sicegar package. However,
# rnorm() will generate symmetric errors, producing less biased numerical parameter estimates.
# We recommend errors generated with rnorm() for any simulation studies on sicegar.
time <- seq(3, 24, 0.5)

#simulate intensity data and add noise
noise_parameter <- 0.1
intensity_noise <- stats::runif(n = length(time), min = 0, max = 1) * noise_parameter
intensity <- sigmoidalFitFormula(time, maximum = 4, slopeParam = 1, midPoint = 8)
intensity <- intensity + intensity_noise

dataInput <- data.frame(intensity = intensity, time = time)
normalizedInput <- normalizeData(dataInput)
parameterVector <- sigmoidalFitFunction(normalizedInput, tryCounter = 2)

#Check the results
if(parameterVector$isThisaFit){
 intensityTheoretical <- sigmoidalFitFormula(time,
                                             maximum = parameterVector$maximum_Estimate,
                                             slopeParam = parameterVector$slopeParam_Estimate,
                                             midPoint = parameterVector$midPoint_Estimate)

 comparisonData <- cbind(dataInput, intensityTheoretical)

 require(ggplot2)
 ggplot(comparisonData) +
   geom_point(aes(x = time, y = intensity)) +
   geom_line(aes(x = time, y = intensityTheoretical)) +
   expand_limits(x = 0, y = 0)
}


if(!parameterVector$isThisaFit){
  print(parameterVector)
}
if(!parameterVector$isThisaFit){
print(parameterVector)
}