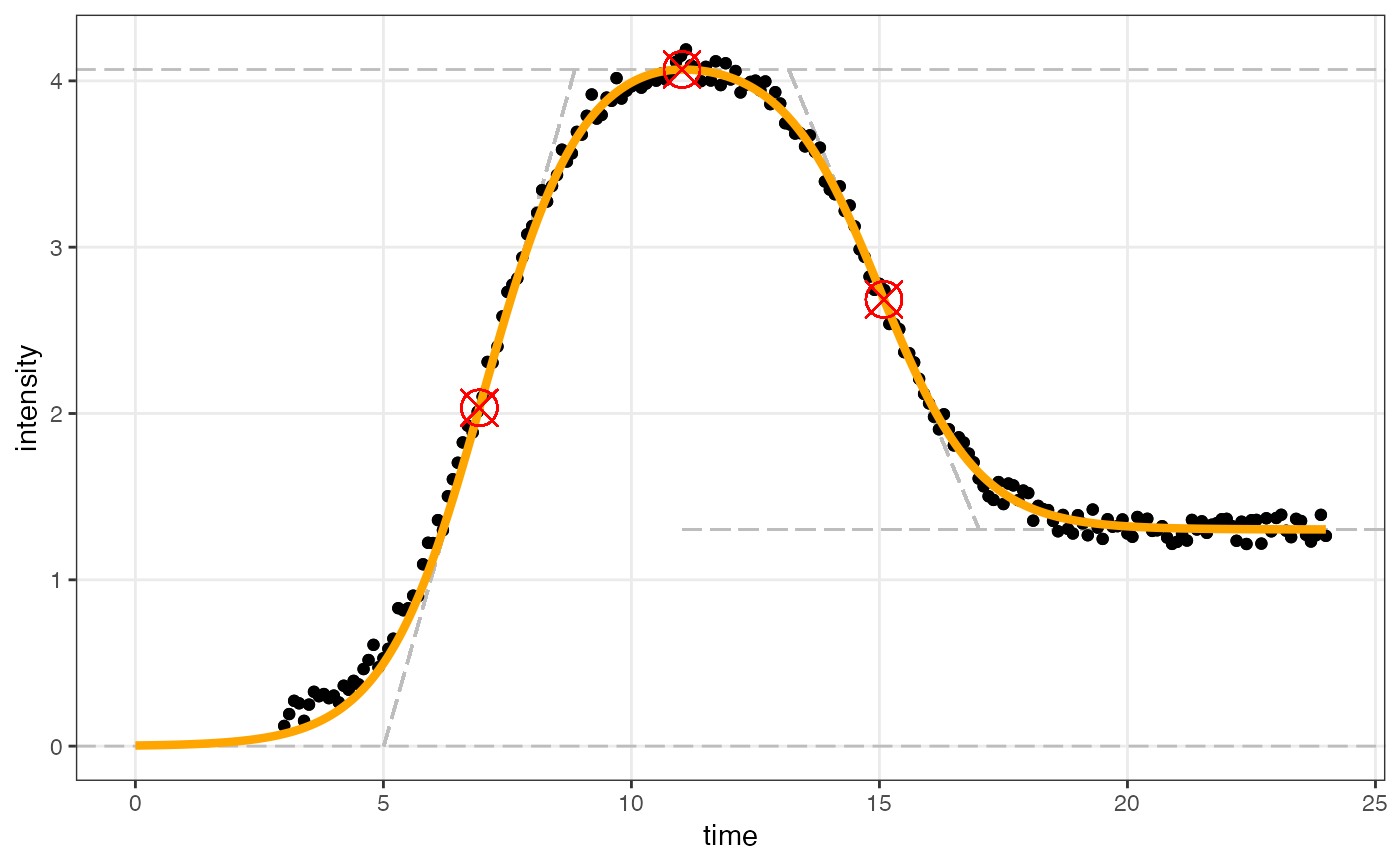
Generates figures using ggplot that shows the input data and the fitted curves.
Usage
figureModelCurves(
  dataInput,
  sigmoidalFitVector = NULL,
  doubleSigmoidalFitVector = NULL,
  showParameterRelatedLines = FALSE,
  xlabelText = "time",
  ylabelText = "intensity",
  fittedXmin = 0,
  fittedXmax = NA,
  use_h0 = FALSE
)
Arguments
- dataInput
A dataframe or a list containing the dataframe. The data frame should be composed of at least two columns. One represents time, and the other represents intensity. The data should be normalized with the normalize data function sicegar::normalizeData() before imported into this function.
- sigmoidalFitVector
the output of the sicegar::sigmoidalFitFunction(), or the augmented version of the output generated by sicegar::parameterCalculation(), which contains parameters from the sigmoidal model. Default is NULL.
- doubleSigmoidalFitVector
the output of the sicegar::doubleSigmoidalFitFunction(), or the augmented version of the output generated by sicegar::parameterCalculation(), which contains parameters from the double sigmoidal model. Default is NULL.
if equal to TRUE, figure will show parameter related lines on the curves. Default is FALSE.
- xlabelText
the x-axis name; with default "time"
- ylabelText
the y-axis name; with default "intensity"
- fittedXmin
the minimum of the fitted data that will be plotted (Default 0)
- fittedXmax
the maximum of the fitted data that will be plotted (Default timeRange)
- use_h0
Boolean which decides whether to fix the lower asymptote of h0 at 0 (FALSE, default) or to freely estimate h0 (TRUE)
Examples
# runif() is used here for consistency with previous versions of the sicegar package. However,
# rnorm() will generate symmetric errors, producing less biased numerical parameter estimates.
# We recommend errors generated with rnorm() for any simulation studies on sicegar.
time <- seq(3, 24, 0.1)

#simulate intensity data and add noise
noise_parameter <- 0.2
intensity_noise <- runif(n = length(time), min = 0, max = 1) * noise_parameter
intensity <- sicegar::doublesigmoidalFitFormula(time,
                                               finalAsymptoteIntensityRatio = .3,
                                               maximum = 4,
                                               slope1Param = 1,
                                               midPoint1Param = 7,
                                               slope2Param = 1,
                                               midPointDistanceParam = 8)
intensity <- intensity + intensity_noise

dataInput <- data.frame(intensity = intensity, time = time)
normalizedInput <- sicegar::normalizeData(dataInput, dataInputName = "sample001")


# Do the double sigmoidal fit
doubleSigmoidalModel <- sicegar::multipleFitFunction(dataInput = normalizedInput,
                                                    model = "doublesigmoidal",
                                                    n_runs_min = 20,
                                                    n_runs_max = 500,
                                                    showDetails = FALSE)

doubleSigmoidalModel <- sicegar::parameterCalculation(doubleSigmoidalModel)

fig01 <- sicegar::figureModelCurves(dataInput = normalizedInput,
                                  doubleSigmoidalFitVector = doubleSigmoidalModel,
                                  showParameterRelatedLines = TRUE)
print(fig01)