library(tidyverse) # ggplot, lubridate, dplyr, stringr, readr...
library(ggstream)
library(praise)Mr Trash Wheel
The Data
This week’s data is Trash Wheel Collection Data from the Mr. Trash Wheel Baltimore Healthy Harbor initiative.
Mr. Trash Wheel is a semi-autonomous trash interceptor that is placed at the end of a river, stream or other outfall. Far too lazy to chase trash around the ocean, Mr. Trash Wheel stays put and waits for the waste to flow to him. Sustainably powered and built to withstand the biggest storms, Mr. Trash Wheel uses a unique blend of solar and hydro power to pull hundreds of tons of trash out of the water each year.
trashwheel <- readr::read_csv('https://raw.githubusercontent.com/rfordatascience/tidytuesday/master/data/2024/2024-03-05/trashwheel.csv')Exploring
We tried out geom_stream() to follow the work of @bjnnowak on fosstodon.org. His code is available, thank you!!
A stream plot is similar to a density plot, but instead of having the bottom flat against the x-axis, it becomes symmetric around the line y = 0. Note that we are plotting the number of items, so it makes sense that cigarette butts will dominate the count.
trash_long <- trashwheel |>
  pivot_longer(cols = PlasticBottles:SportsBalls, names_to = "type", values_to = "count") |>
  mutate(ym = as_date(zoo::as.yearmon(paste(Year, Date), "%Y %m"))) |>
  group_by(ym, Name, type) |>
  summarize(bigcount = sum(count)) |>
  ungroup()
trash_long |>
ggplot(aes(x = ym, y = bigcount, fill = type, color = type)) +
geom_stream(geom = "contour", extra_span = 0.1, bw = 0.65, size = 0.75) +
geom_stream(geom = "polygon", extra_span = 0.1, bw = 0.65, size = 0.75) +
facet_wrap(~ Name, ncol = 1, scales = "free_y") +
scale_fill_brewer(palette = "Set1") +
scale_color_brewer(palette = "Set1") +
labs(x = "", y = "", color = "", fill = "",
title = "Number of trash items of each type found by each Wheel",
caption = "Figure made by Jo Hardin | Code originally by @bjnnowak") +
theme_minimal()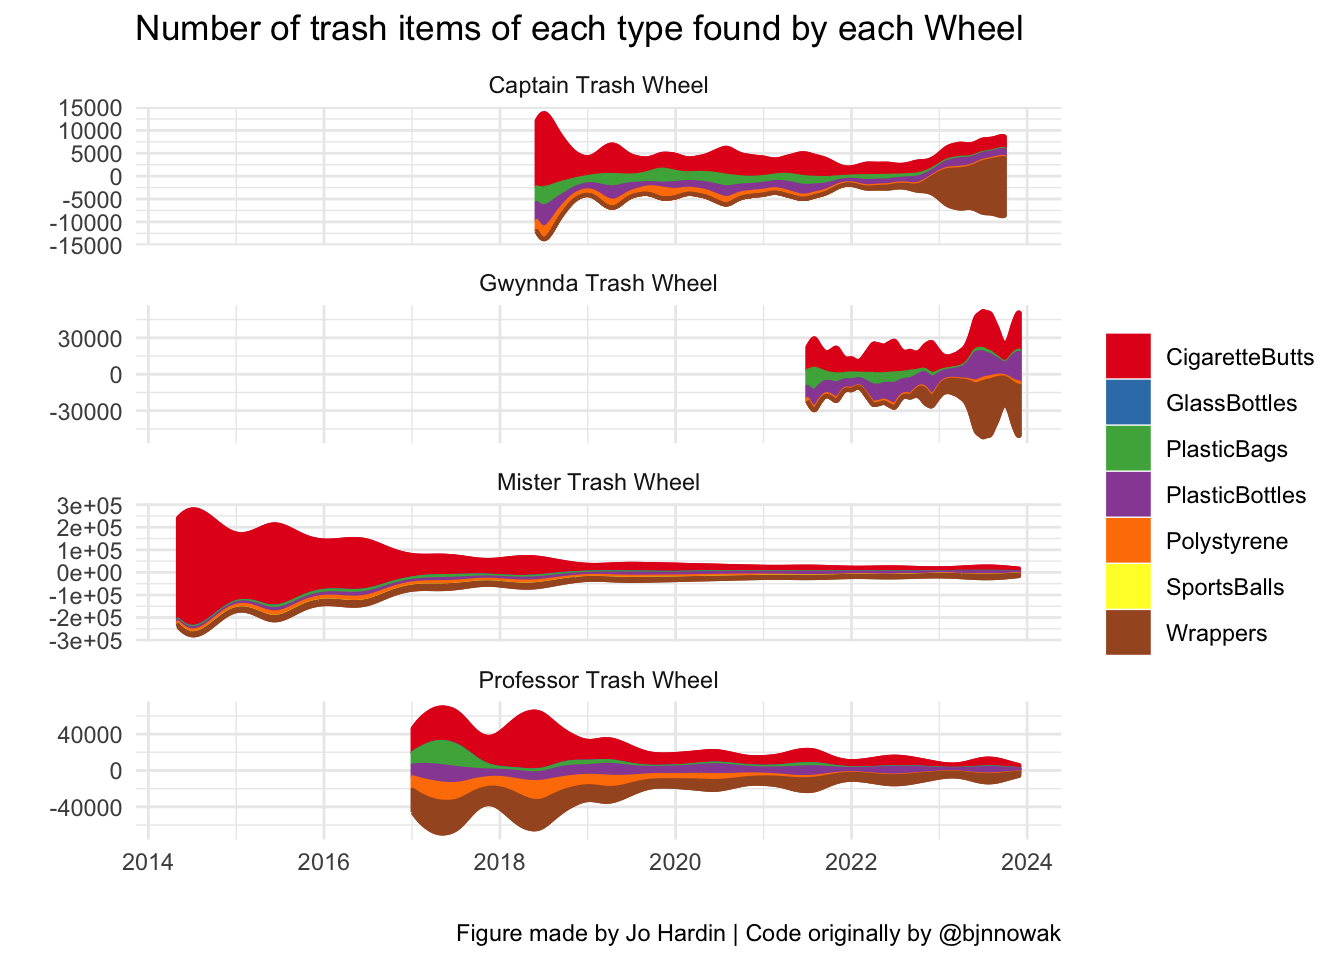
praise()[1] "You are solid!"