library(tidyverse) # ggplot, lubridate, dplyr, stringr, readr...
library(praise)Valentine’s Day Consumer Data
The Data
Happy Valentine’s Day! This week we’re exploring Valentine’s Day survey data. The National Retail Federation in the United States conducts surveys and has created a Valentine’s Day Data Center so you can explore the data on how consumers celebrate.
historical_spending <- readr::read_csv('https://raw.githubusercontent.com/rfordatascience/tidytuesday/master/data/2024/2024-02-13/historical_spending.csv')
gifts_age <- readr::read_csv('https://raw.githubusercontent.com/rfordatascience/tidytuesday/master/data/2024/2024-02-13/gifts_age.csv')
gifts_gender <- readr::read_csv('https://raw.githubusercontent.com/rfordatascience/tidytuesday/master/data/2024/2024-02-13/gifts_gender.csv')

inflation <- c(1, 1.032, 1.021, 1.015, 1.016, 1.001, 1.013, 1.021,
               1.024, 1.018, 1.012, 1.047, 1.08)
infl_prod <- cumprod(inflation)

historical_spending <- historical_spending |>
  cbind(inflation, infl_prod) |>
  mutate(perperson_adj = PerPerson / infl_prod)
historical_spending |>
rename(no_adjustment = PerPerson, inflation_adjusted = perperson_adj) |>
pivot_longer(cols = c("no_adjustment", "inflation_adjusted"),
values_to = "spending",
names_to = "adjustment") |>
ggplot(aes(x = Year, y = spending, color = adjustment)) +
geom_point() +
geom_line() +
ylab("Valentine's Spending") +
scale_color_manual(values = c("red", "magenta")) +
scale_x_continuous(breaks= scales::pretty_breaks())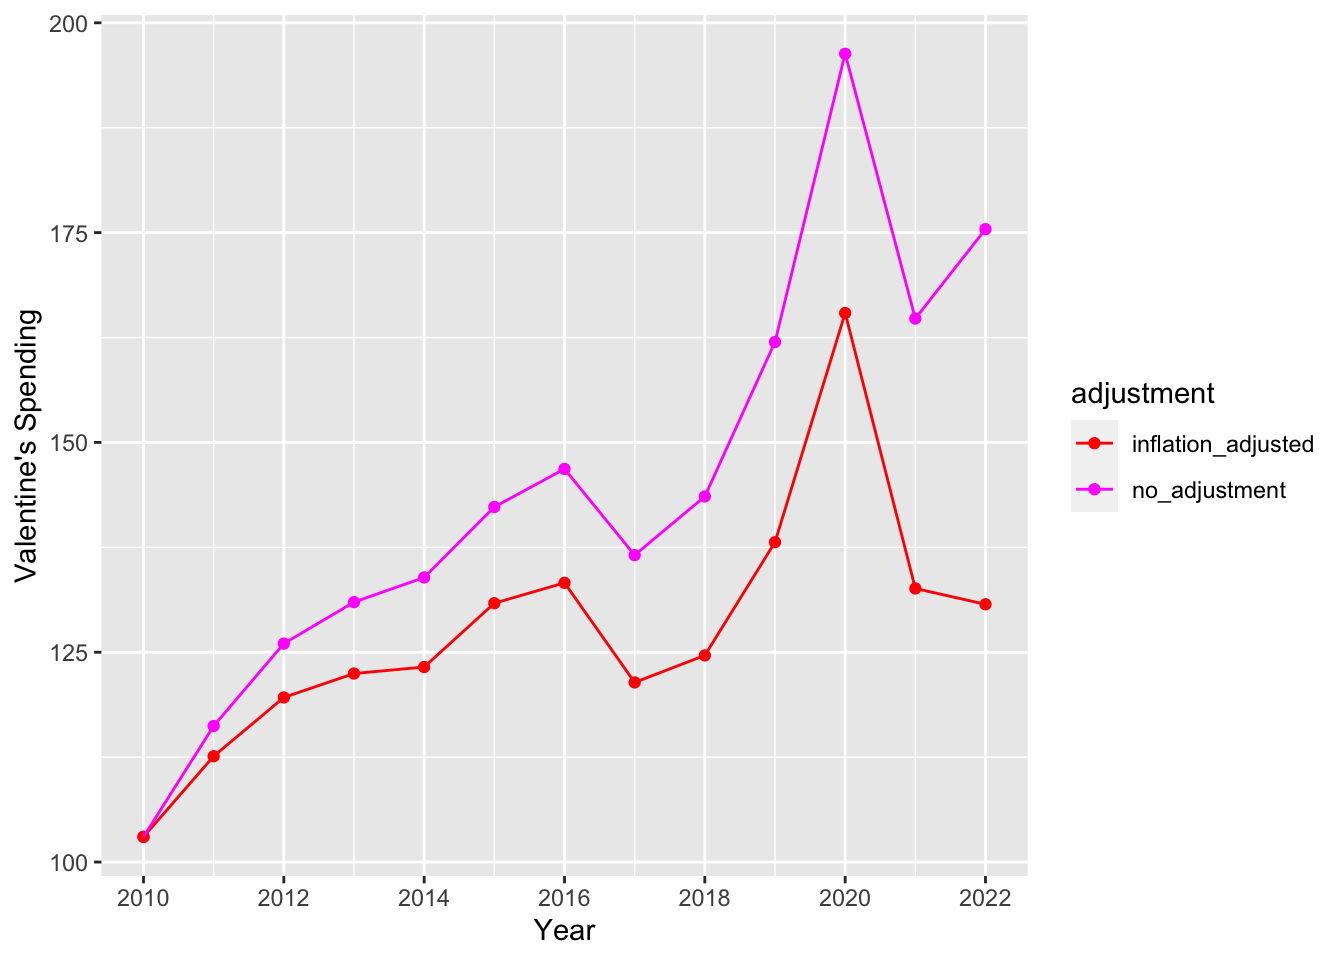
cbp2 <- c( "#E69F00", "#56B4E9", "#009E73","#000000",
          "#F0E442", "#0072B2", "#CC79A7", "#D55E00")

gifts_gender |>
  filter(Gender == "Women") |>
  pivot_longer(cols = Candy:GiftCards,
               names_to = "type",
               values_to = "percent") |>
  mutate(type = fct_reorder(type, percent)) |>
  mutate(not_spend = 100-percent) |>
  pivot_longer(cols = percent:not_spend,
               values_to = "percent",
               names_to = "spend") |>
  ggplot(aes(x = type, y = percent, fill = type, alpha = spend)) +
    geom_bar(stat = "identity") +
  geom_text(aes(label = percent, x = type, y = 100,
                color = spend), size = 5, hjust = 1.2) +
  #scale_alpha_manual(values = c(0,1)) +
  coord_polar(theta = "y") +
  scale_fill_manual(values = cbp2) +
  scale_color_manual(values = c("white","black")) +
  theme(panel.background = element_blank(),
        axis.title = element_blank(),
        axis.text.y = element_blank(),
        axis.ticks.y = element_blank()) +
  guides(alpha = FALSE, color = FALSE) +
  labs(fill = "Spending type") +
  ggtitle("Spending habits of women on Valentine's Day")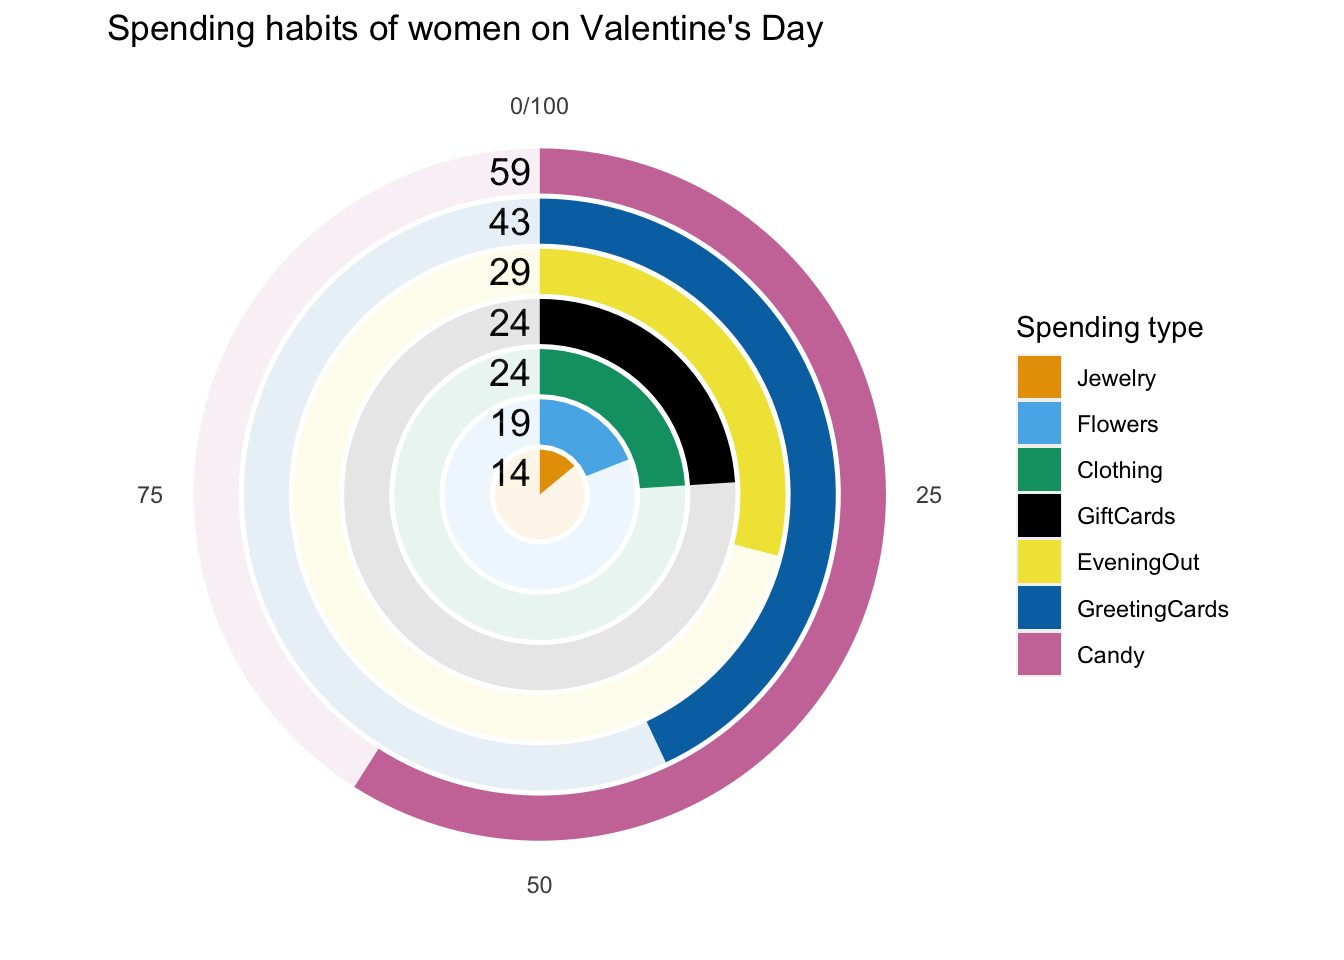
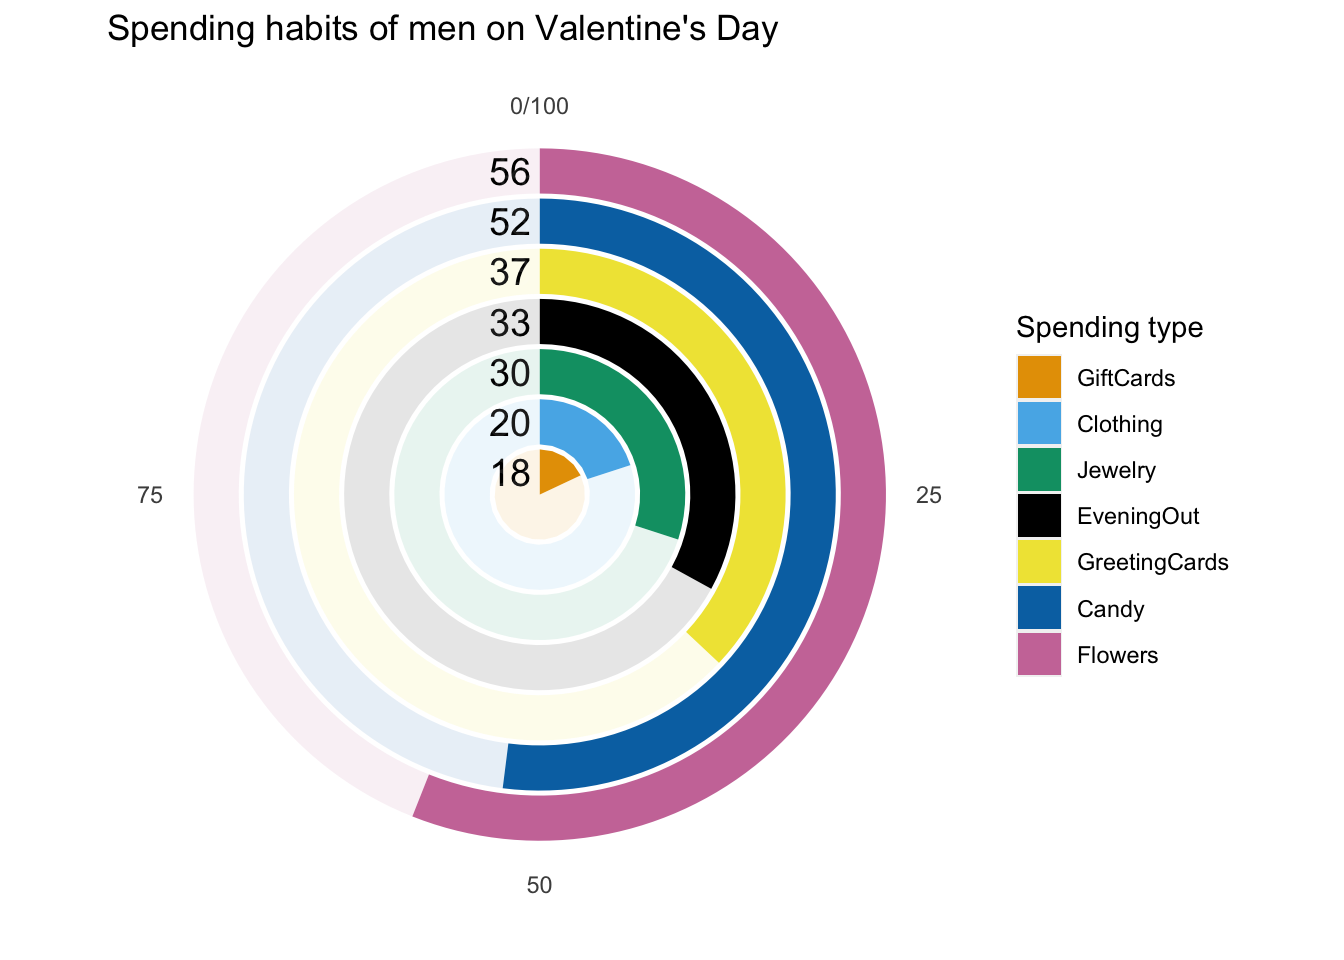
gifts_gender |>
  filter(Gender == "Men") |>
  pivot_longer(cols = Candy:GiftCards,
               names_to = "type",
               values_to = "percent") |>
  mutate(type = fct_reorder(type, percent)) |>
  mutate(not_spend = 100-percent) |>
  pivot_longer(cols = percent:not_spend,
               values_to = "percent",
               names_to = "spend") |>
  ggplot(aes(x = type, y = percent, fill = type, alpha = spend)) +
    geom_bar(stat = "identity") +
  geom_text(aes(label = percent, x = type, y = 100,
                color = spend), size = 5, hjust = 1.2) +
  #scale_alpha_manual(values = c(0,1)) +
  coord_polar(theta = "y") +
  scale_fill_manual(values = cbp2) +
  scale_color_manual(values = c("white","black")) +
  theme(panel.background = element_blank(),
        axis.title = element_blank(),
        axis.text.y = element_blank(),
        axis.ticks.y = element_blank()) +
  guides(alpha = FALSE, color = FALSE) +
  labs(fill = "Spending type") +
  ggtitle("Spending habits of men on Valentine's Day")