library(tidyverse) # ggplot, lubridate, dplyr, stringr, readr...
library(praise)UNESCO World Heritage Sites
The Data
This week we’re exploring a very small subset of UNESCO World Heritage Sites. The 1 dataset, 100 visualizations project used this dataset to explore different ways of visualizing a simple dataset.
heritage <- readr::read_csv('https://raw.githubusercontent.com/rfordatascience/tidytuesday/master/data/2024/2024-02-06/heritage.csv')heritage_long <- heritage |>
mutate(percent = paste0(floor(100*(`2022`/`2004` - 1)), "%")) |>
pivot_longer(`2004`:`2022`,names_to = "year", values_to = "num_sites") |>
mutate(year = as.numeric(year)) |>
mutate(small_year = ifelse(year == 2004, "'04", "'22"))Lollipop #3
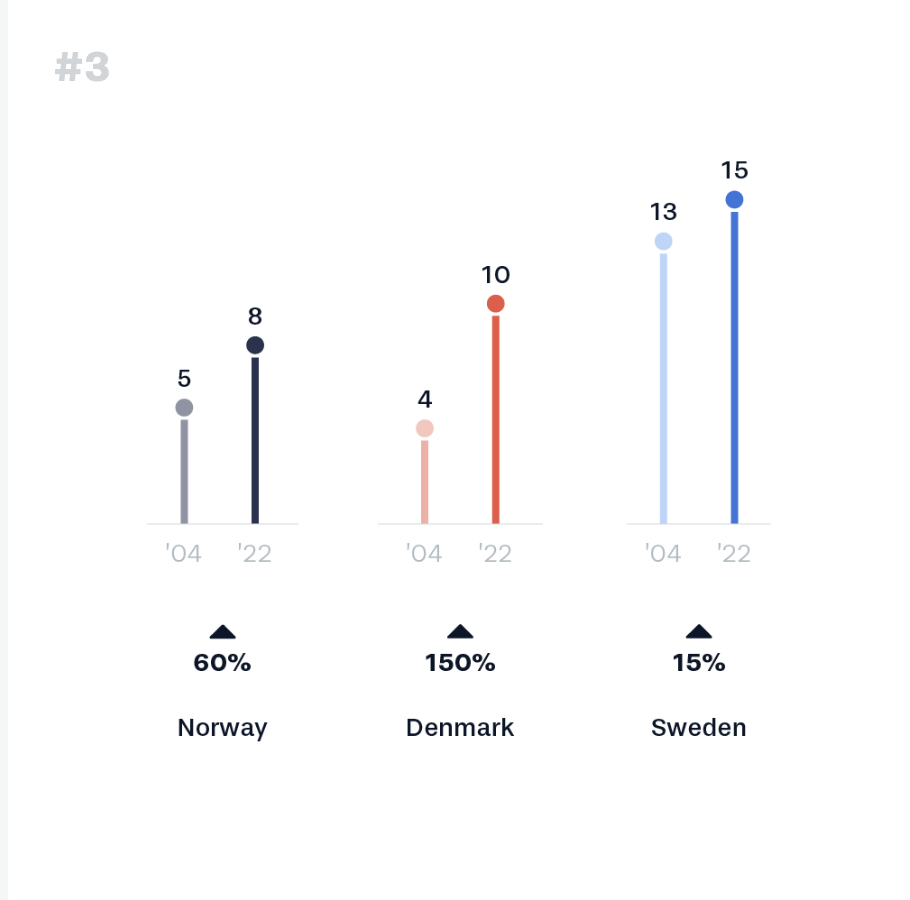
Our goal is to recreate the lollipop graph in Figure 1 which was created by the Data Viz Project at https://100.datavizproject.com/
heritage_long |>
  mutate(country = fct_relevel(country, "Norway", "Denmark", "Sweden")) |>
 ggplot(aes(y=num_sites, color=country, x=year)) +
  geom_point(size = 3.5, aes(alpha = as.factor(year))) +
  geom_segment(aes(xend=year, yend=num_sites-.5, alpha = as.factor(year)),
               y=0, size = 1.5) +
  geom_text(aes(label = percent), x = 2013, y = -4, color = "black") +
  geom_point(pch = 17, size = 3, x = 2013, y = -3, color = "black") +
  geom_text(aes(label = small_year, x = year), y = -1, color = "darkgrey",
            alpha = 1) +
  geom_text(aes(label = num_sites, x = year, y = num_sites + 1.5), color = "black") +
  ylim(c(-5,17)) +
  xlim(c(1990, 2035)) +
  facet_wrap(~country, strip.position = "bottom") +
  ylab("") + xlab("") +
  scale_color_manual(values = c("black", "#f05541", "#3374da")) +
  scale_alpha_manual(values = c(0.4,1,0.4,1,0.4,1)) +
  theme(panel.background = element_blank(),
        axis.ticks.x = element_blank(),
        axis.text.x = element_blank(),
        axis.ticks.y = element_blank(),
        axis.text.y = element_blank(),
        legend.position = "none",
        strip.background = element_blank(),
strip.text.x = element_text(size = 14)) 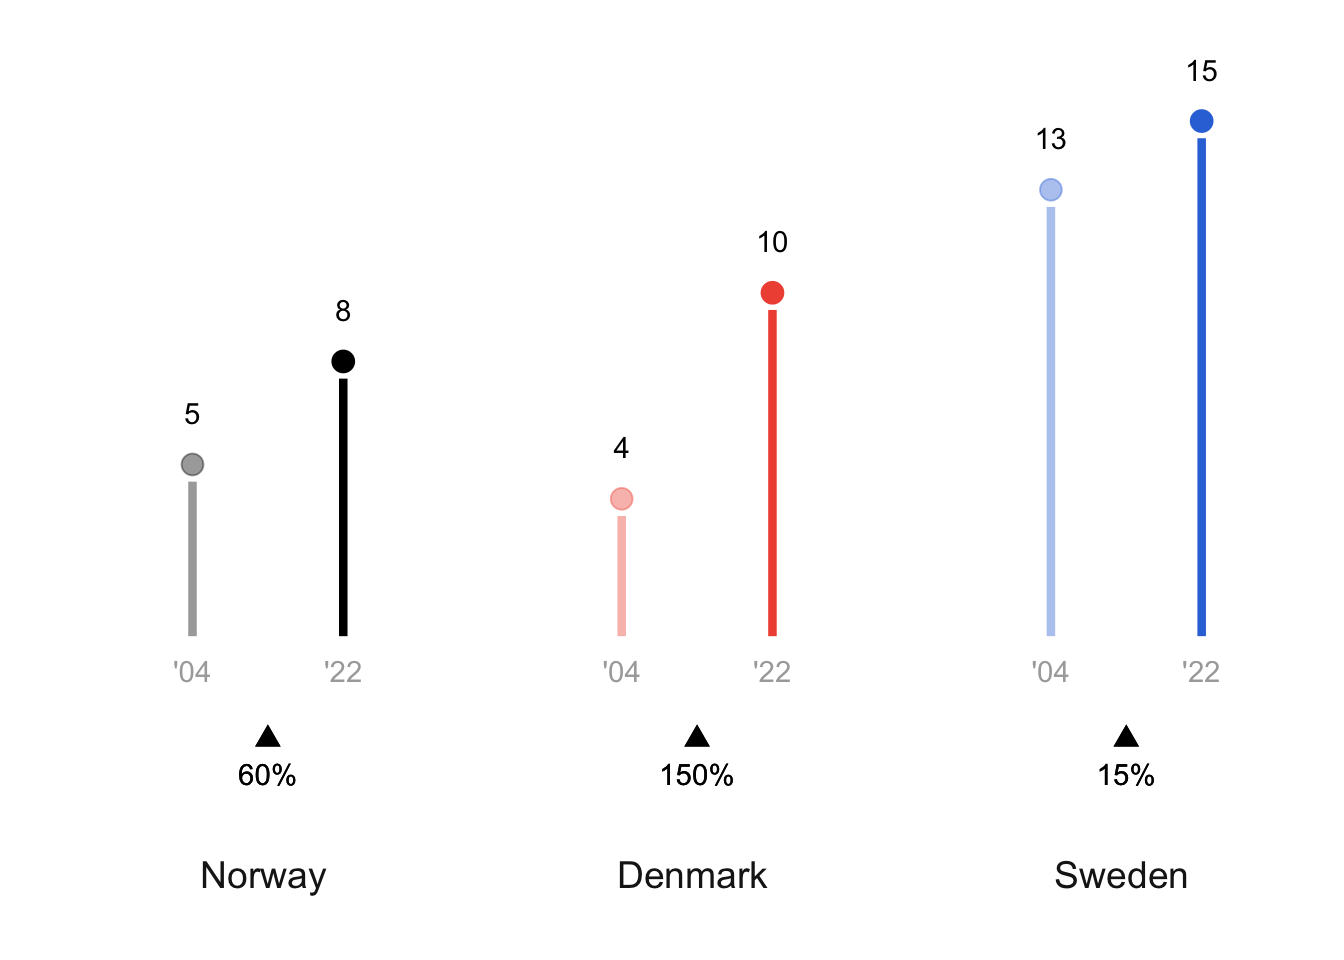
praise()[1] "You are phenomenal!"