library(tidyverse) # ggplot, lubridate, dplyr, stringr, readr...
library(tidytext)
library(praise)
library(paletteer)
library(ggforce)
library(networkD3)
library(plotly)Dr. Who
The Data
The data this week comes from Wikipedia’s [List of Doctor Who episodes](https://en.wikipedia.org/wiki/List_of_Doctor_Who_episodes_(2005%E2%80%93present) via the {datardis} package by Jonathan Kitt.
directors <- read_csv("drwho_directors.csv")
episodes <- read_csv("drwho_episodes.csv")
writers <- read_csv("drwho_writers.csv")
p <- episodes |>
left_join(writers, by = "story_number") |>
group_by(writer) |>
mutate(n_episodes = n()) |>
filter(n_episodes >= 5) |>
ggplot(aes(x = uk_viewers, y = rating, color = writer, label = episode_title)) +
geom_point() +
facet_wrap( ~ writer) +
ggthemes::scale_color_colorblind() +
guides(color="none") +
labs(x = "number of views, UK (millions)", y = "appreciation index",
title = "Evaluting Dr. Who writers")
ggplotly(p, tooltip = c("episode_title"))It isn’t clear where the rating came from. Maybe IMDb? Let’s scrape the IMDb website to see if the ratings are the same as what was used in the original dataset. From what I know, British ratings are provided by randomly sampled households using a device in their house to provide a measure of how good the show is. It is called the Appreciation Index.
library(rvest)
library(purrr)

scrape_imdb <- function(i){
  imdb_rating <- paste0("https://www.imdb.com/title/tt0436992/episodes/?season=", i, sep = "") |>
  read_html() |>
  html_elements("span[aria-label^='IMDb']") |>
  html_text2() |>
  str_extract("[\\d\\.]+(?=/)") |>
  as.numeric()

  episode <- paste0("https://www.imdb.com/title/tt0436992/episodes/?season=", i, sep = "") |>
  read_html() |>
  html_nodes(xpath = "//div[@class='ipc-title__text']") |>
  html_text2() |>
  str_extract("[S\\d\\.E\\d]+(?=\\s)") |>
    data.frame() |>
    setNames("ep.seas") |>
  mutate(season_number = as.numeric(str_extract(ep.seas, "\\d+")),
         episode_number = as.numeric(str_extract(ep.seas, "(?<=E)\\d+")))

  data.frame(imdb_rating, episode)

}

imdb_who <- 1:13 |>
  map_dfr(scrape_imdb)
episodes |>
left_join(imdb_who, by = c("season_number", "episode_number")) |>
ggplot(aes(x = imdb_rating, y = rating)) +
geom_point() +
labs(x = "IMDb rating", y = "Appreciation Index",
title = "Comparing two different ratings")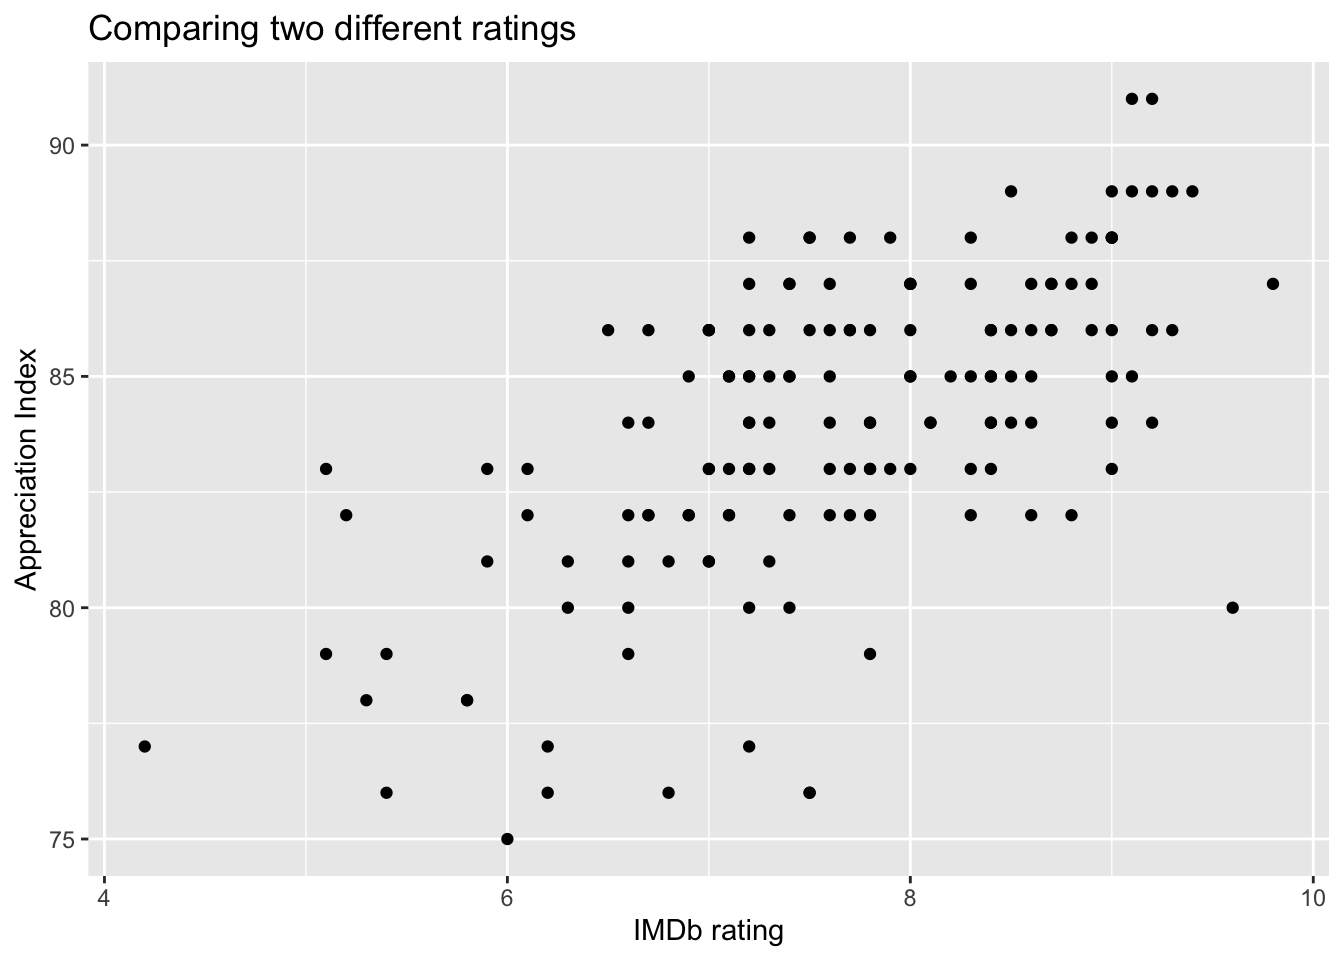
praise()[1] "You are shining!"