library(tidyverse)
library(praise)Egg Production
The Data
The data this week comes from The Humane League’s US Egg Production dataset by Samara Mendez. Dataset and code is available for this project on OSF at US Egg Production Data Set.
cage_free <- read_csv("cage-free-percentages.csv")
egg_prod <- read_csv("egg-production.csv")
Over time
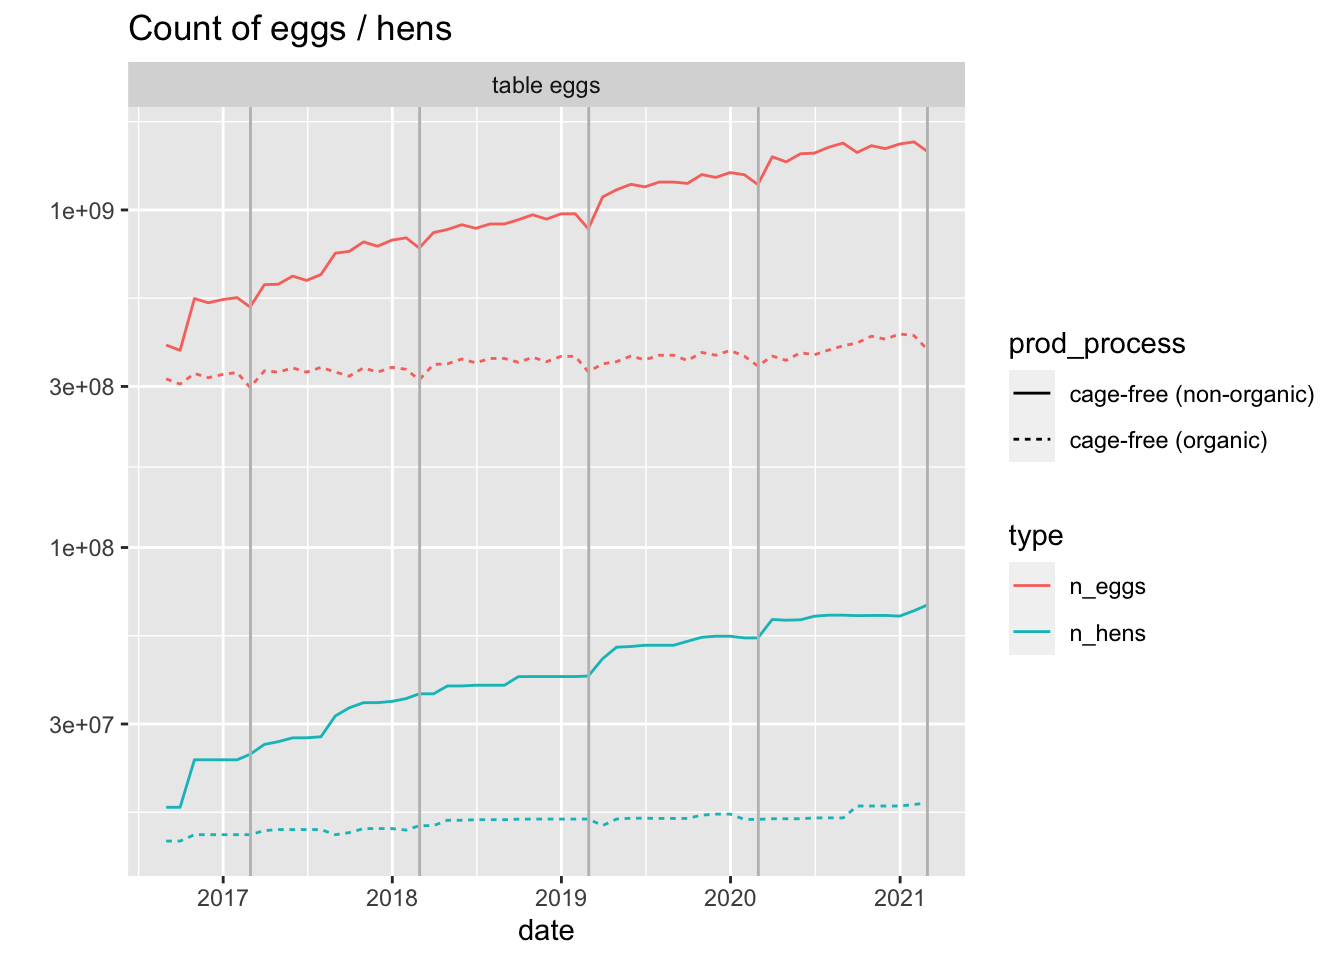
Something happens on March 1st every year. Maybe some of the eggs are taken out of the system to hatch to become hens? Or something else, I have no idea.
egg_prod |>
  filter(prod_type == "table eggs") |>
  filter(prod_process != "all") |>
  pivot_longer(n_hens:n_eggs, names_to = "type", values_to = "count") |>
  ggplot(aes(x = observed_month, y = count, color = type)) +
  geom_line(aes(linetype = prod_process)) +
  scale_y_log10() +
  geom_vline(xintercept = as.numeric(as.Date("2017-03-01")), col = "grey") +
  geom_vline(xintercept = as.numeric(as.Date("2018-03-01")), col = "grey") +
  geom_vline(xintercept = as.numeric(as.Date("2019-03-01")), col = "grey") +
  geom_vline(xintercept = as.numeric(as.Date("2020-03-01")), col = "grey") +
  geom_vline(xintercept = as.numeric(as.Date("2021-03-01")), col = "grey") +
  facet_wrap(~ prod_type) +
  xlab("date") + ylab("") +
  ggtitle("Count of eggs / hens")