Premier League Soccer

Author

Jo Hardin

Published

April 4, 2023

library(tidyverse)
library(tidytext)
library(praise)
library(scales)

The Data

The data this week comes from the Premier League Match Data 2021-2022 via Evan Gower on Kaggle.

soccer <- read_csv("soccer21-22.csv")

Half time vs Full time

soccer |> 
  select(HTR, FTR) |>
  table()
   FTR
HTR  A  D  H
  A 77 14 10
  D 44 51 56
  H  8 23 97
soccer |>
  ggplot(aes(x = FTR, fill = HTR)) + 
  geom_bar()

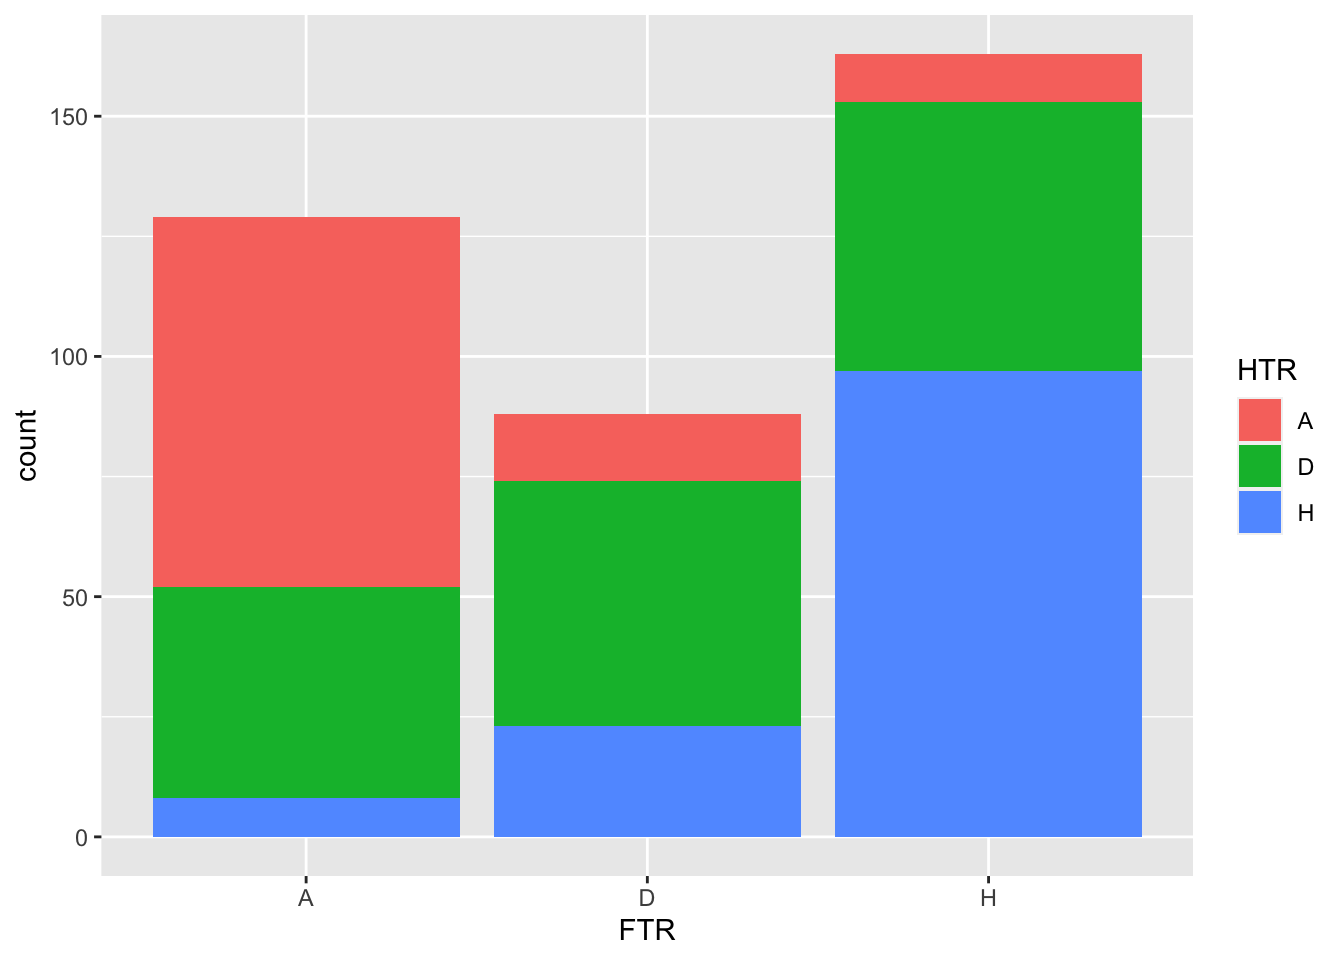
# install.packages("remotes")
# remotes::install_github("davidsjoberg/ggsankey")
library(ggsankey)
soccer_sankey <- soccer |>
  make_long(HTR, FTR)


soccer_sankey |>
  ggplot(aes(x = x, next_x = next_x,
             node = node, next_node = next_node,
             fill = node, label = node)) + 
  geom_sankey(flow.alpha = 0.5, node.color = "gray30") + 
  geom_sankey_label(size = 2, color = "white", fill = "gray40") +
  theme_void() +
  theme(legend.position = "none") 
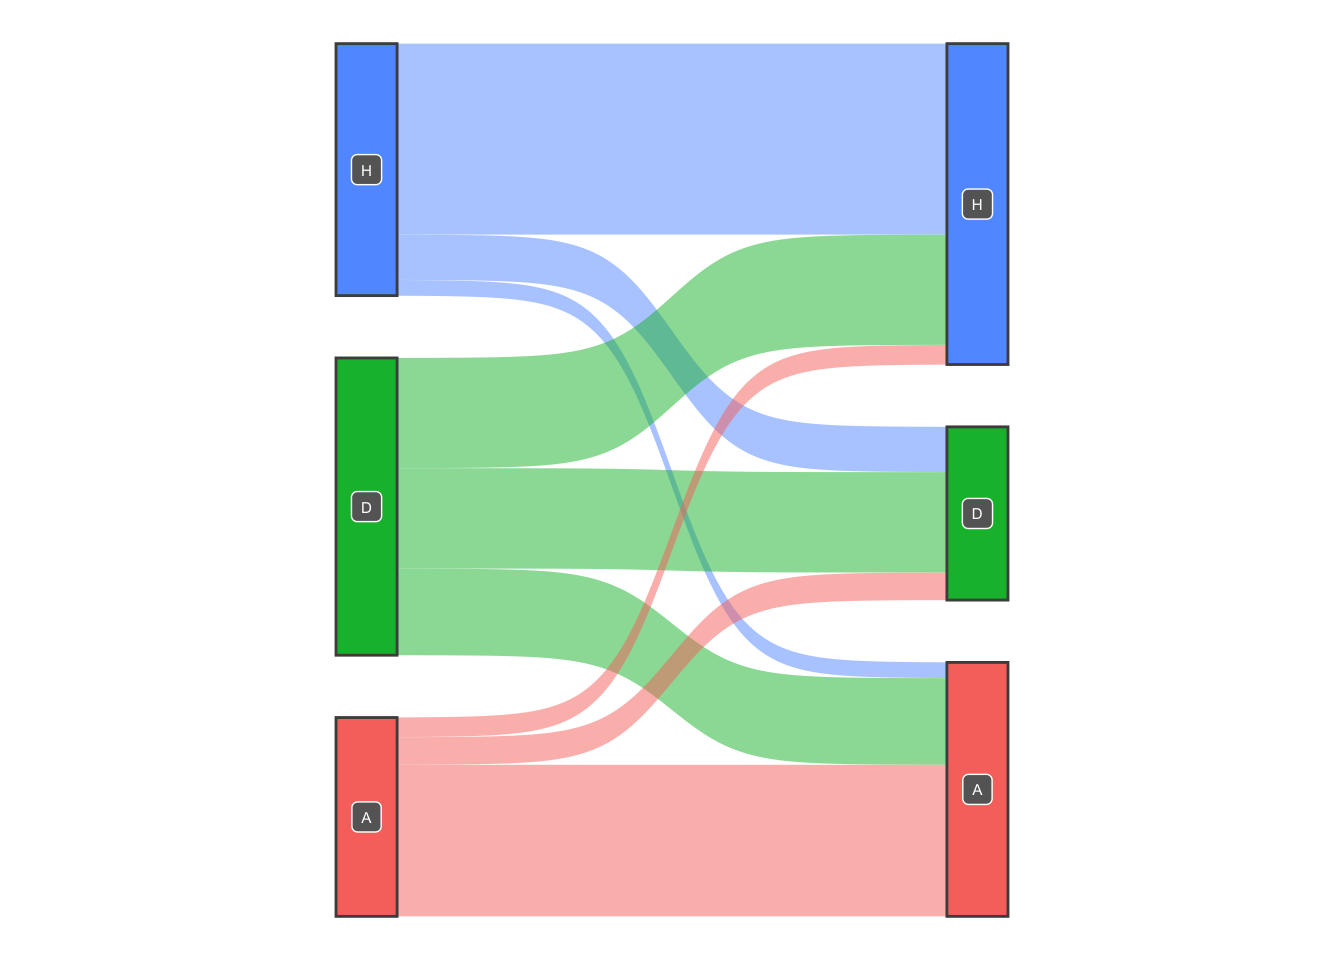
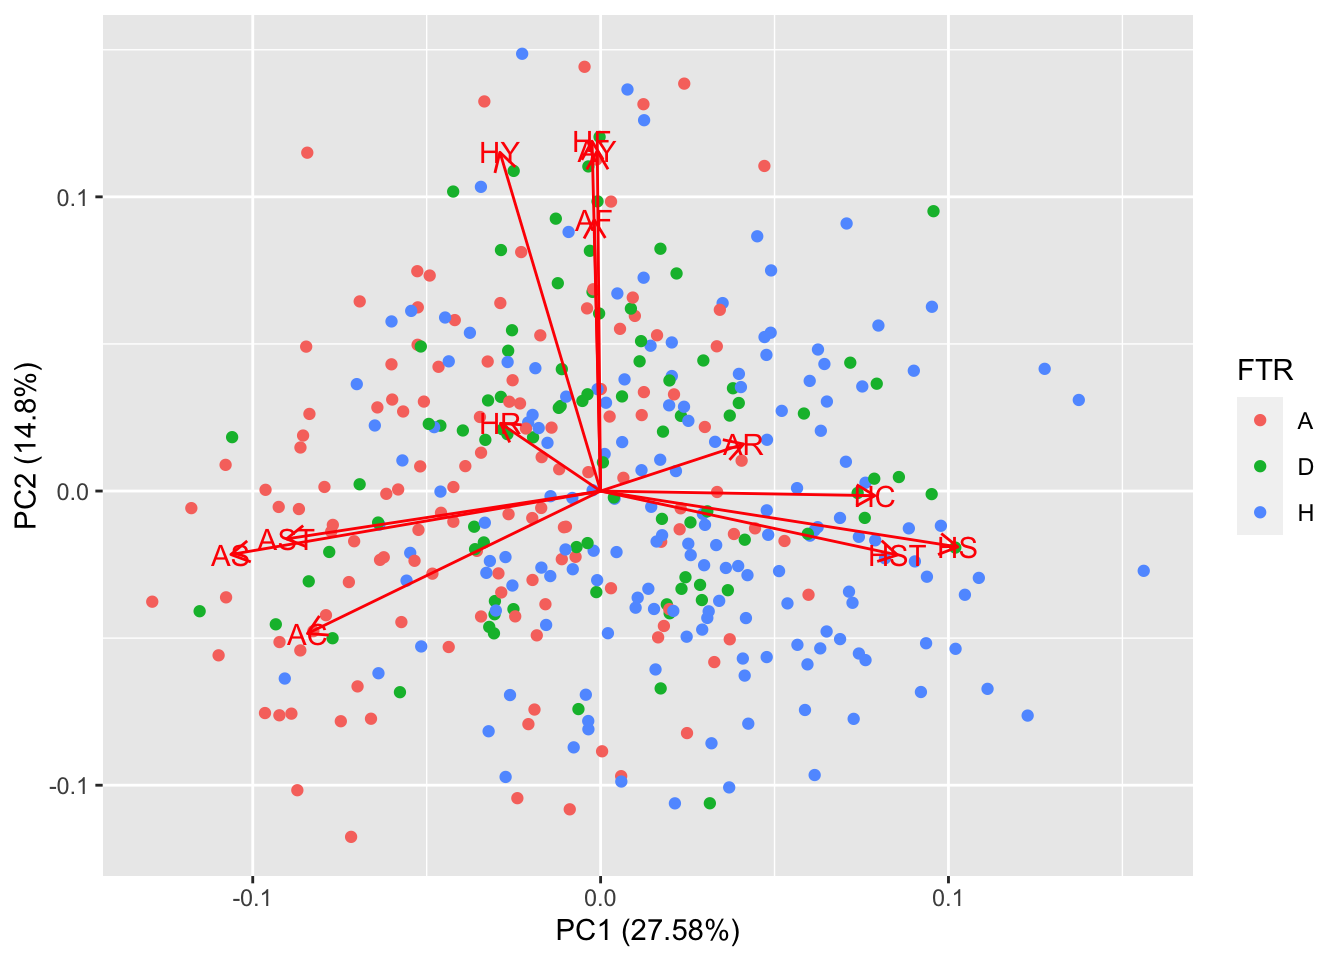
PCA

library(ggfortify)
soccer_pca <- soccer |>
  dplyr::select(HS,AS, HST, AST, HF, AF, HC, AC, HY, AY, HR, AR) |>
  prcomp(scale. = TRUE)
soccer_pca |>
  autoplot(data = soccer, loadings = TRUE, loadings.label = TRUE, 
           color = "FTR")

A scatter plot with the first principal component on the x-axis and the second principal component on the y-axis.  Points are colored based on whether the home team won, the away team won, or the match ended in a draw.  There are additional arrows superimposed on the points describing the principal component loadings (direction and weight) for each of the quantitative variables used -- Number of shots taken by the home team; Number of shots taken by the away team; Number of shots on target by the home team ; Number of shots on target by the away team; Number of fouls by the home team; Number of fouls by the away team; Number of corners taken by the home team; Number of corners taken by the away team; Number of yellow cards received by the home team; Number of yellow cards received by the away team; Number of red cards received by the home team; Number of red cards received by the away team

PCA plot showing a separation of the away team wins (on the left side) and the home team wins (on the right side) which are somewhat distinguished by the number of shots / shots on target / corners for home versus away.