Alone TV
The Data
The data this week comes from the Alone data package by Dan Oehm.
Less common items
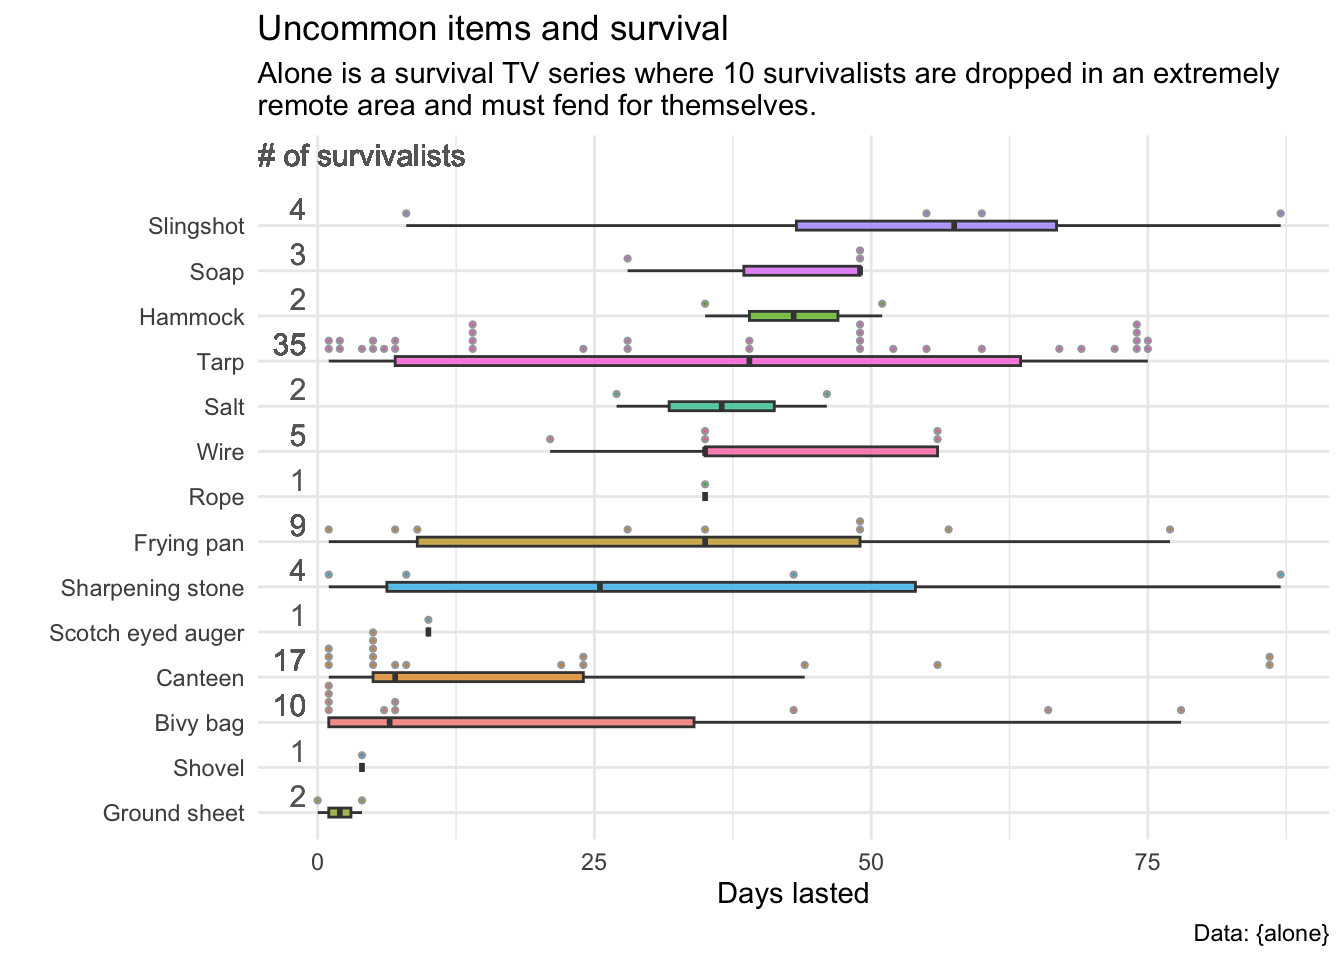
There are certain items which are very popular. When you look at the participants who used the less common items, which of those less common items are more associated with longer survival?
# A tibble: 27 × 2
   item           count
   <chr>          <int>
 1 Pot               92
 2 Fishing gear      90
 3 Sleeping bag      85
 4 Axe               80
 5 Saw               80
 6 Ferro rod         77
 7 Rations           68
 8 Bow and arrows    60
 9 Paracord          56
10 Knife             51
# … with 17 more rows
# A tibble: 14 × 2
item count
<chr> <int>
1 Tarp 30
2 Canteen 12
3 Bivy bag 8
4 Frying pan 6
5 Sharpening stone 4
6 Slingshot 3
7 Wire 3
8 Ground sheet 2
9 Hammock 2
10 Salt 2
11 Soap 2
12 Rope 1
13 Scotch eyed auger 1
14 Shovel 1Forty-seven contestants (out of the 94 original survivalists) chose to bring one or more of the less common items?
# A tibble: 47 × 2
   name               count
   <chr>              <int>
 1 Brad Richardson        5
 2 Brooke Whipple         4
 3 Dave Whipple           4
 4 Josh Richardson        4
 5 Jesse Bosdell          3
 6 Justin Vititoe         3
 7 Alan Kay               2
 8 Brody Wilkes           2
 9 Carleigh Fairchild     2
10 Chris Weatherman       2
# … with 37 more rows
To find out which less common items are associated with longer survival, we need to join the loadouts data with the survivalists data. Much of the image is copied from code due to @martijnvanbloois@fosstodon.org.
[1] "You are solid!"