drought_county <- read_csv("drought-fips.csv")
drought_state <- read_csv("drought.csv")Drought Conditions in the US
6/14/2022
Data
The data this week comes from the National Integrated Drought Information System.
This web page provides more information about the drought conditions data.
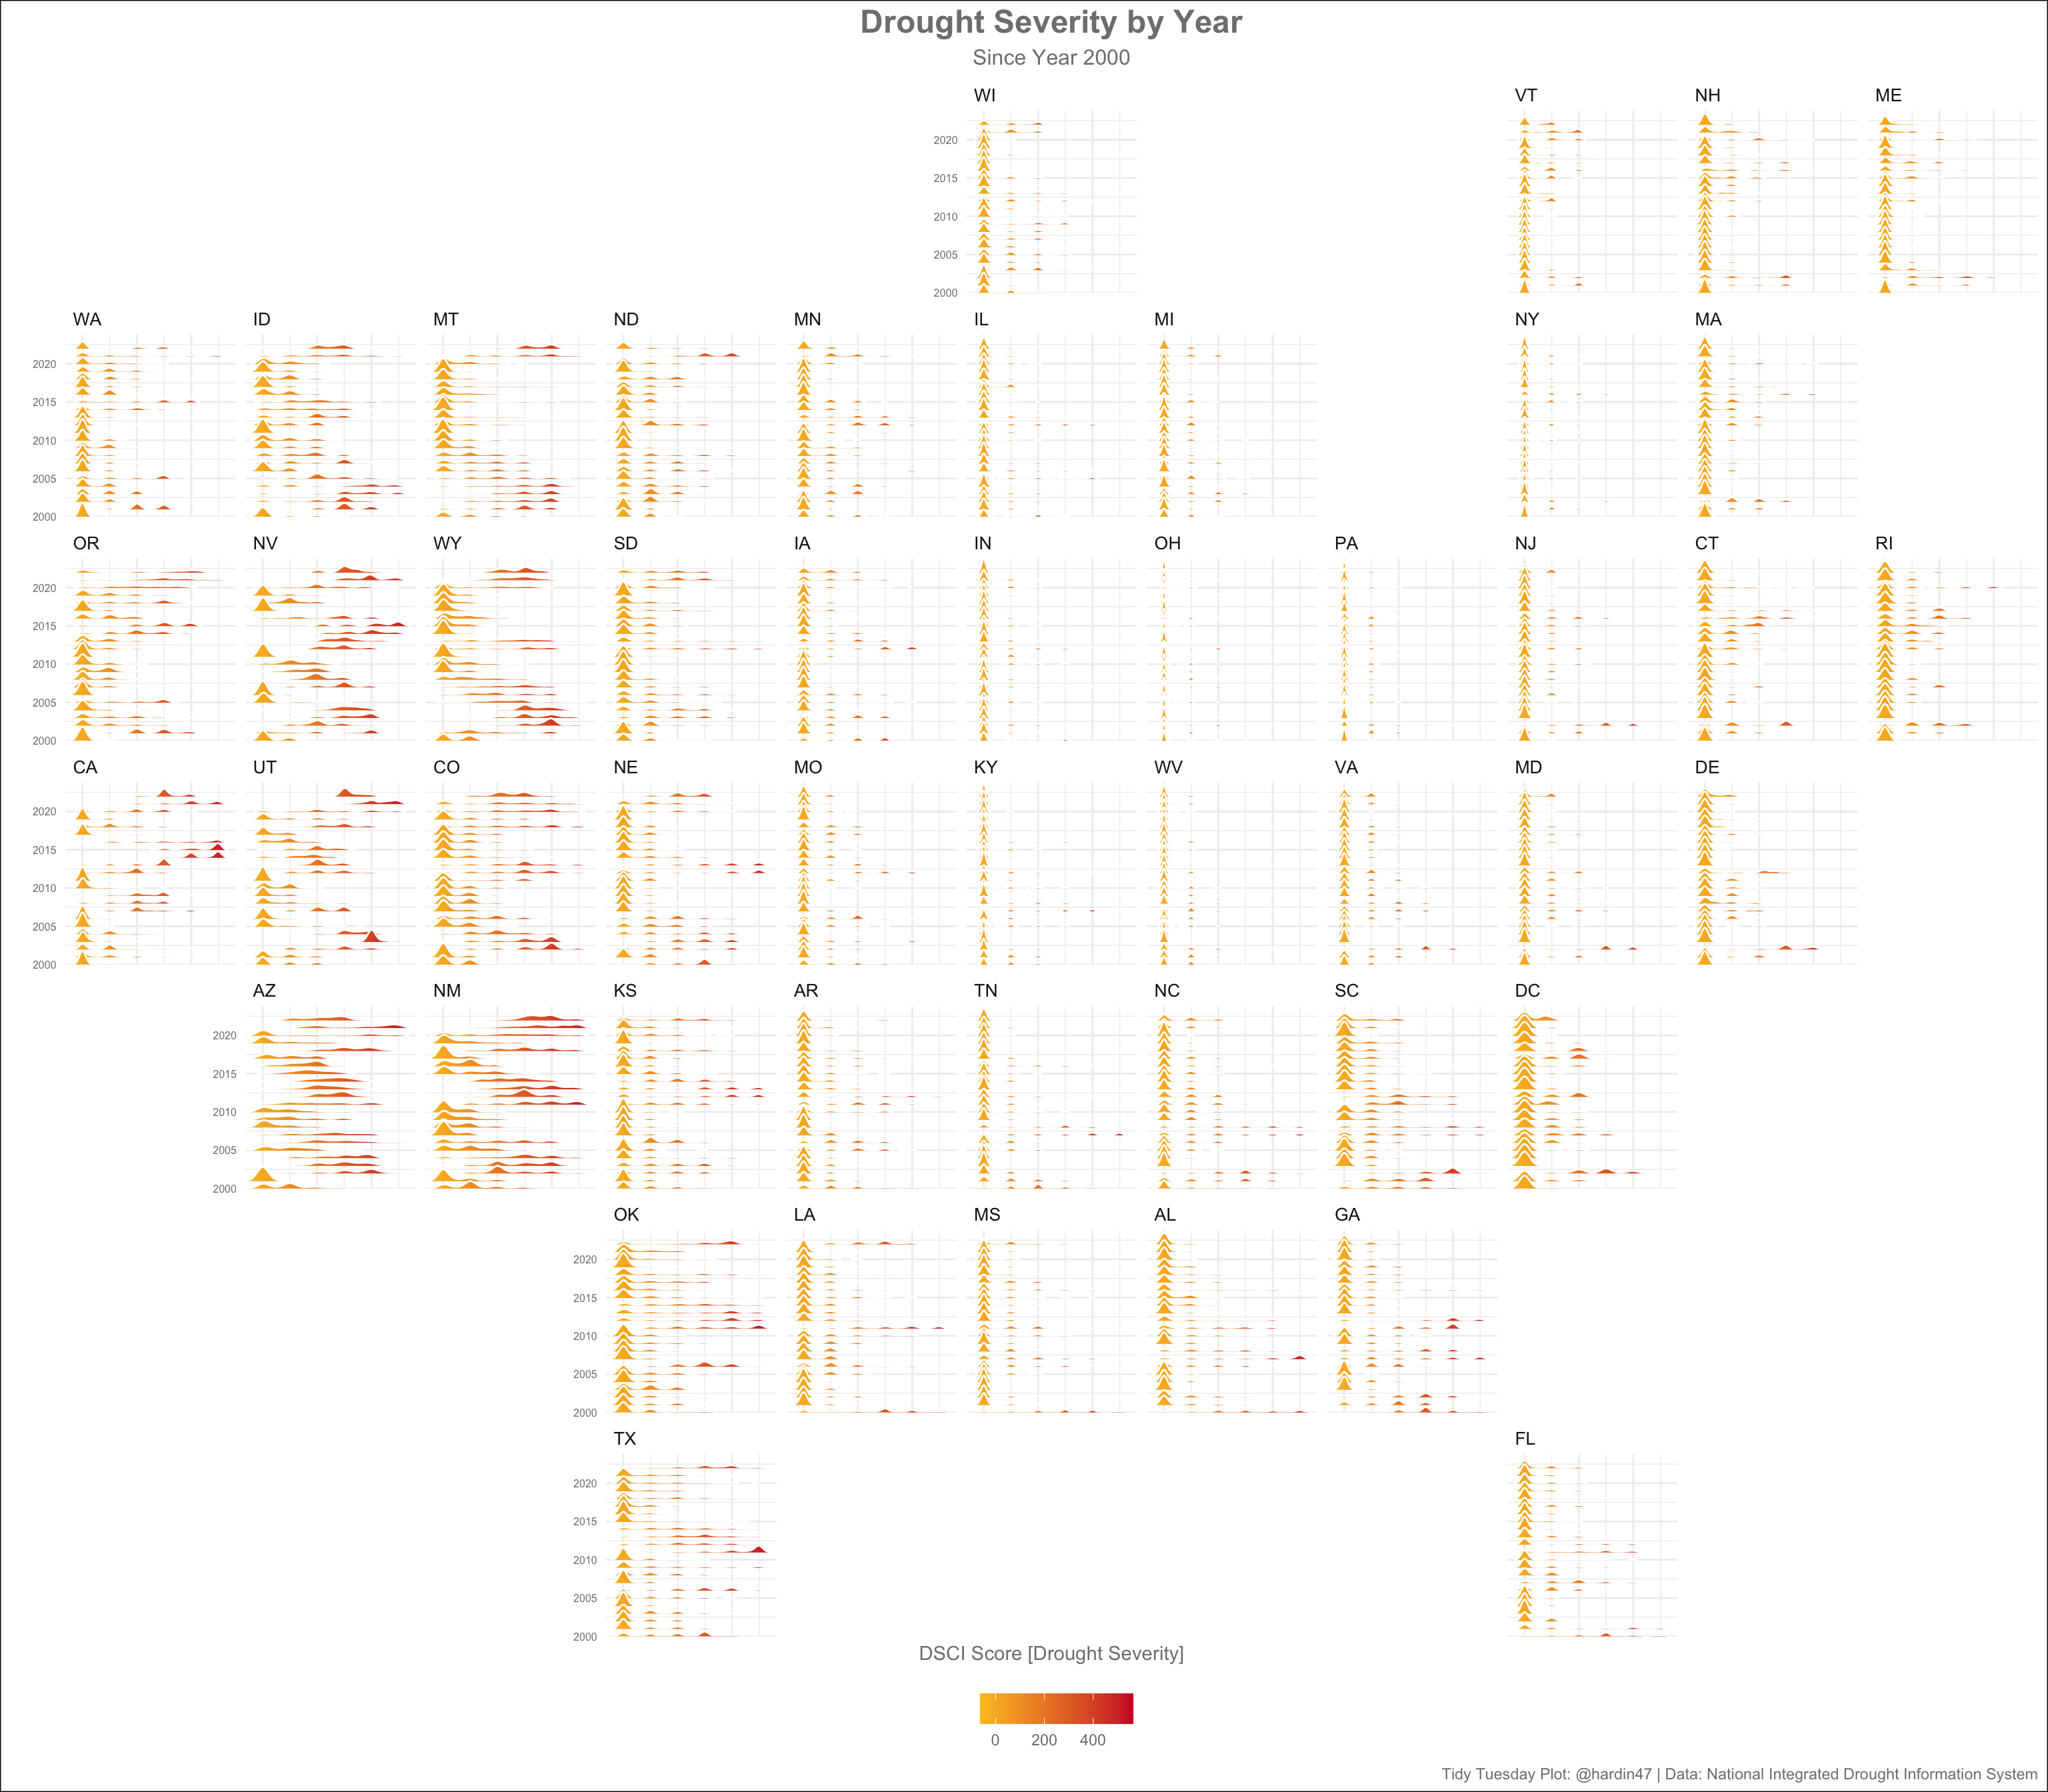
ggridges by state
h/t to @adambushman for the ggridges idea and @nrennie for the formatting of the facet_geo.
drought_county_state <- drought_county %>% group_by(State) %>%
  summarize(State = first(State))

drought_county %>%
  #dplyr::filter(State == "CA") %>%
  mutate(year = year(ymd(date))) %>%
  ggplot(aes(x = DSCI, y = year, group = year, fill = stat(x))) +
  ggridges::geom_density_ridges_gradient(rel_min_height = 0.01, color = "#ffffff") +
  facet_geo(~State, grid = "us_state_contiguous_grid1") +
  scale_fill_gradient(high = '#d0162e', low = '#fcc425') +
  labs(title = 'Drought Severity by Year',
       subtitle = 'Since Year 2000',
       y = '',
       x = 'DSCI Score [Drought Severity]',
       fill = 'DSCI',
       caption = "Tidy Tuesday Plot: @hardin47 | Data: National Integrated Drought Information System") +
  theme_minimal() +
  coord_cartesian(expand = FALSE) +
  theme(
    plot.background = element_rect(fill = '#ffffff'),
    text = element_text(color = '#808080'),
    axis.text = element_text(color = '#808080'),
    panel.grid.major = element_line(color = '#efefef'),
    panel.grid.minor = element_line(color = '#efefef'),
    plot.title = element_text(size = 18, hjust = 0.5, face = 'bold'),
    plot.subtitle = element_text(size = 12, hjust = 0.5),
    legend.position = "bottom",
    legend.title = element_blank(),
    panel.grid = element_blank(),
    axis.text.x = element_blank(),
    axis.text.y = element_text(size = 6),
    axis.ticks = element_blank(),
    strip.background = element_blank(),
    strip.text = element_text(hjust = 0, size = 10)
  )