all_pride <- read_csv("contribution_data_all_states.csv") %>%
  drop_na(Company) %>%
  group_by(Company) %>%
  mutate(tot_spend = sum(Amount)) %>%
  filter(tot_spend >= 65000) %>%
  ungroup() %>%
  mutate(Company = ifelse(Company == "Southern Company (Georgia Power, Alabama Power, Mississippi Power)", "Southern Company Power", Company)) %>%
  mutate(Company = factor(Company, levels=unique(Company[order(desc(tot_spend))]), ordered=TRUE))

levels(all_pride$Company) <- stringr::str_wrap( levels(all_pride$Company), width=12 )

#all_pride %>% select(Company) %>% table()Pride Donations
6/7/2022
The Data
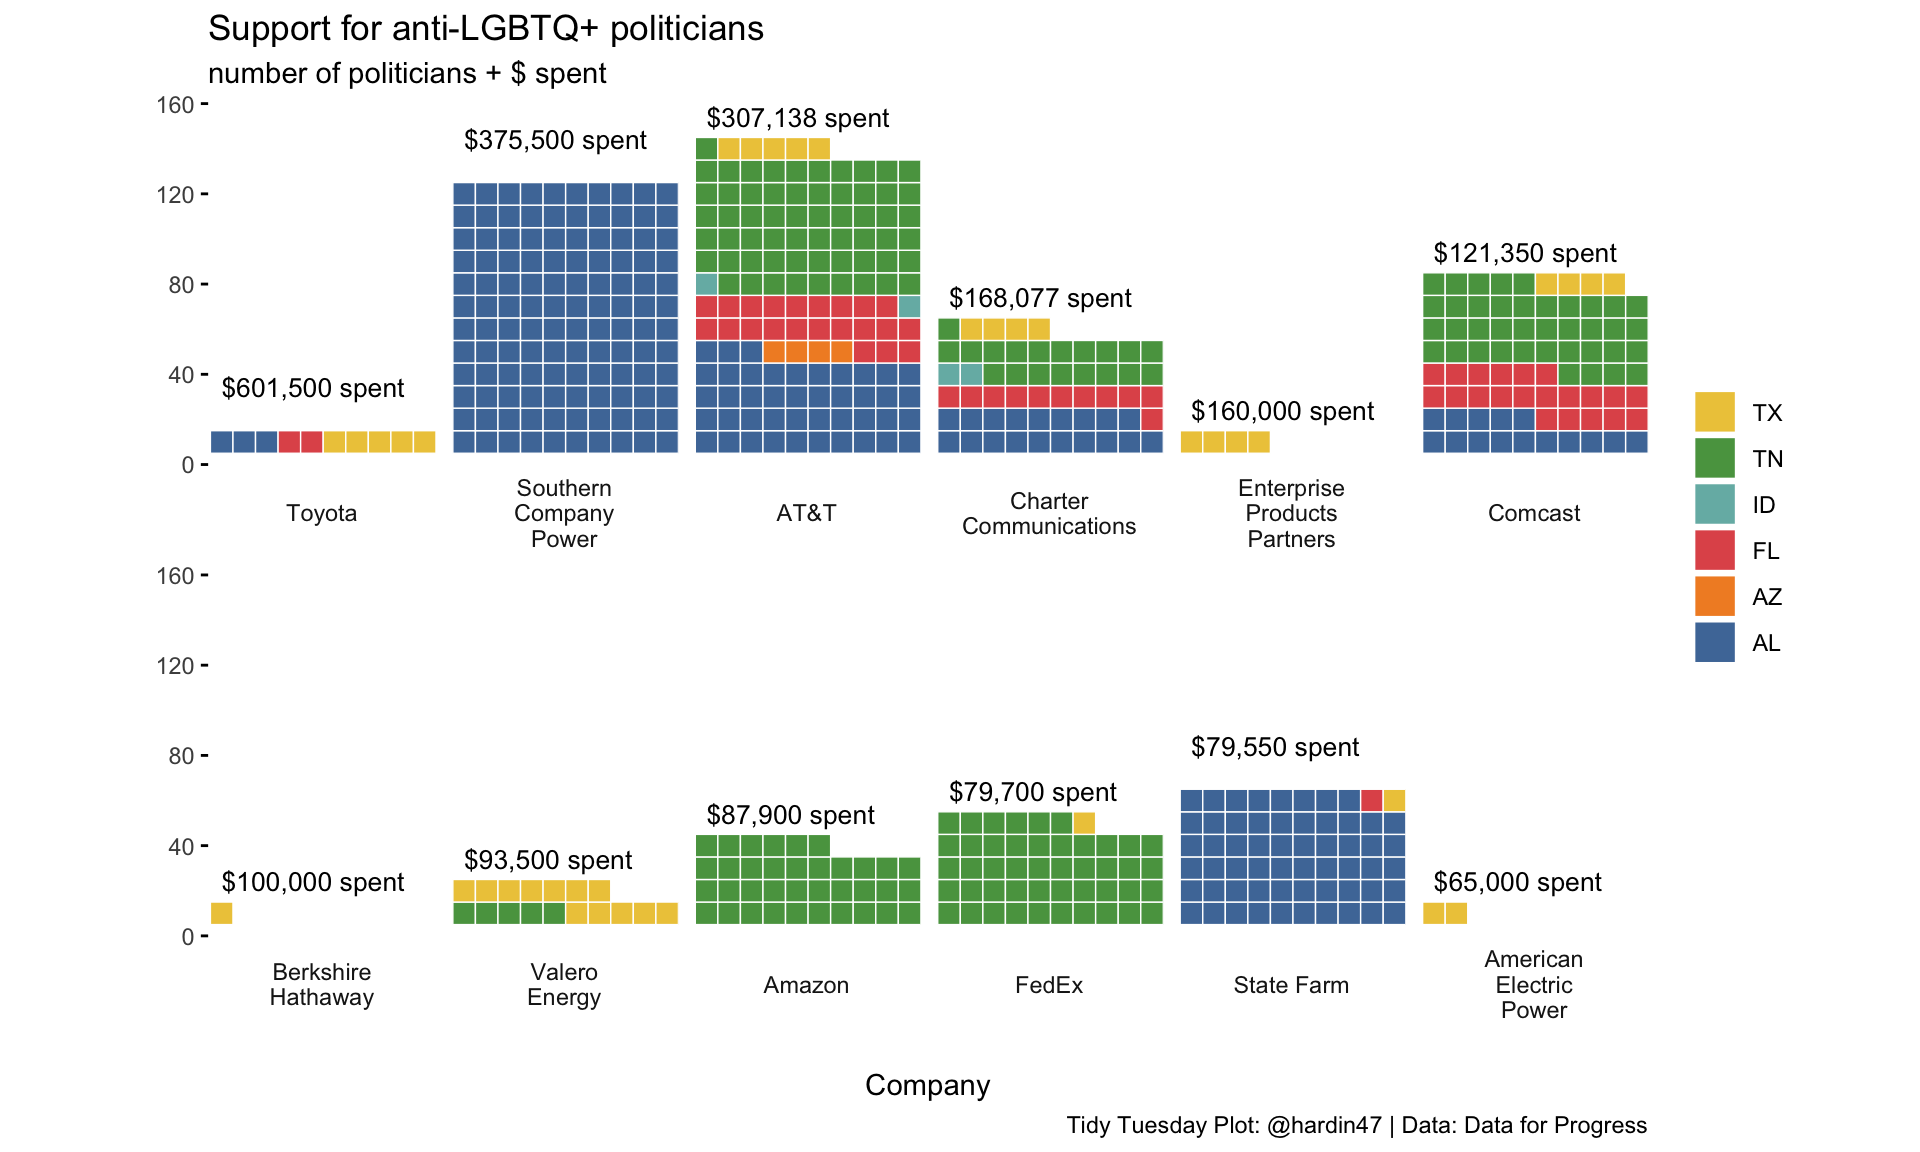
The data this week comes from Data For Progress. The data describe donations to anti-LGBTQ+ organizations with information on political fallout.
Donations to anti-LGBTQ+ politicians
library(waffle)

gg <- glue::glue

all_pride_waffle <- all_pride %>%
  group_by(Company, State) %>%
  summarize(n = n(), tot_spend = sum(Amount))

all_pride_waffle2 <- all_pride_waffle %>%
  group_by(Company) %>%
  summarize(tot_spend = sum(tot_spend), tot_pol = sum(n))


all_pride_waffle %>%
ggplot() +
  geom_waffle(aes(fill = State, values = n), color = "white", size = .25, n_rows = 10, flip = TRUE) +
  #geom_text(aes(x = Company, y = tot_pol %/% 10,
   #             label = paste(" total donation: $",tot_spend, sep = ""))) +
  scale_x_discrete(limits = "") +
  scale_y_continuous(labels = function(x) x * 10, # multiplier same as n_col
                     expand = c(0,0),
                     limits = c(0,16)) +
  geom_text(
    data = tibble(
      idx = c(1:12),
      Company = all_pride_waffle2$Company[idx],
      y = (all_pride_waffle2$tot_pol[idx] %/% 10),
      actual_spend = all_pride_waffle2$tot_spend[idx],
      lab = gg("{scales::comma(actual_spend, 1, prefix = '$')} spent")
    ),
    aes(1, y, label = lab),
    vjust = 0, hjust = 0, nudge_y = 2,
    size = 3.5, lineheight = 0.875
  ) +
  facet_wrap(~Company, nrow = 2, strip.position = "bottom") +
  ggthemes::scale_fill_tableau(name=NULL) +
  coord_equal() +
  labs(
    title = "Support for anti-LGBTQ+ politicians",
    subtitle = "number of politicians + $ spent",
    x = "Company",
    y = "",
    caption = "Tidy Tuesday Plot: @hardin47 | Data: Data for Progress") +
  theme_minimal() +
  theme(panel.grid = element_blank(), axis.ticks.y = element_line()) +
  guides(fill = guide_legend(reverse = TRUE))